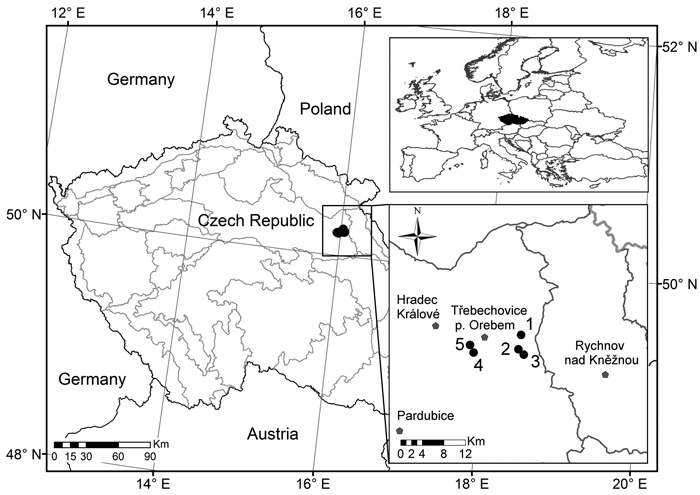
Fig. 1. Location of the permanent research plots 1–5 (black dots) in which the pine stands were investigated.
| Table 1. Overview of the basic characteristics of permanent research plots in 2015. | |||||||||
| Plot name | GPS | Age | Height | DBH | Volume | Altitude | Forest site type | Soil type | |
| m | cm | m3 ha–1 | m a.s.l. | ||||||
| 1 | Třebechovice 1 | 50.202°45´N 16.059°01´E | 90 | 21 | 27 | 410 | 267 | 1M7 - Pineto-Quercetum oligotrophicum arenosum | Dystric Arenic Cambisol |
| 2 | Třebechovice 2 | 50.196°27´N 16.056°46´E | 80 | 23 | 27 | 380 | 260 | 0K1 - Querceto-Pinetum acidophilum | Dystric Arenic Cambisol |
| 3 | Třebechovice 3 | 50.196°80´N 16.056°97´E | 80 | 26 | 21 | 300 | 260 | 0K1 - Querceto-Pinetum acidophilum | Podzol Arenic |
| 4 | Třebechovice 4 | 50.192°23´N 15.963°74´E | 140 | 22 | 30 | 400 | 245 | 0M2 - Querceto-Pinetum oligotrophicum | Podzol Arenic |
| 5 | Třebechovice 5 | 50.193°34´N 15.961°96´E | 130 | 24 | 28 | 430 | 245 | 0M2 - Querceto-Pinetum oligotrophicum | Podzol Arenic |
| Table 2. Overview of indices describing the stand structure and their common interpretation. | ||||
| Criterion | Quantifiers | Label | Reference | Evaluation |
| Horizontal structure | Index of non-randomness | A (H&Si) | Hopkins, Skellam (1954) | mean value A = 0.5; aggregation A > 0.5; regularity A < 0.5 |
| Aggregation index | R (C&Ei) | Clark, Evans (1954) | mean value R = 1; aggregation R < 1; regularity R > 1 | |
| Index of cluster size | CS (D&Mi) | David, Moore (1954) | mean value CS = 1; aggregation CS > 1; regularity CS < 1 | |
| Vertical diversity | Arten-profil index | Ap (Pri) | Pretzsch (2006) | range 0–1; balanced vertical structure Ap < 0.3; selection forest Ap > 0.9 |
| Structure differen- tiation | Diameter dif. | TMd (Fi) | Füldner (1995) | range 0–1; low TM < 0.3; very high differentiation TM > 0.7 |
| Height dif. | TMh (Fi) | |||
| Crown dif. | K (J&Di) | Jaehne, Dohrenbusch (1997) | minimum K = 0, higher K = higher values; low K < 1.5; high differentiation K > 2.5 | |
| Species diversity | Heterogeneity | H´ (Shi) | Shannon (1948) | minimum H´= 0, higher H´= higher values |
| Evenness | E (Pii) | Pielou (1975) | range 0–1; minimum E = 0, maximum E = 1 | |
| Complex diversity | Stand diversity | B (J&Di) | Jaehne, Dohrenbusch (1997) | monotonous structure B < 4; uneven structure B = 6–8; very diverse structure B > 9 |
| Table 3. Detailed overview of stand characteristics of the tree layer on PRP 1–5 in 2005 and 2015. | |||||||||||||
| PRP | Year | Age | dbh | h | v | N | BA | V | PAI | MAI | CC | CPA | SDI |
| y | cm | m | m3 | trees ha–1 | m2 ha–1 | m3 ha–1 | m3 ha–1 y–1 | m3 ha–1 y–1 | % | ha | |||
| 1 | 2005 | 68 | 25.8 | 19.90 | 0.536 | 644 | 33.5 | 345 | 8.0 | 4.42 | 80.2 | 1.62 | 0.66 |
| 2015 | 80 | 27.1 | 21.44 | 0.627 | 660 | 38.1 | 414 | 8.1 | 5.18 | 77.1 | 1.47 | 0.73 | |
| 2 | 2005 | 59 | 26.3 | 21.33 | 0.531 | 644 | 35.1 | 342 | 7.5 | 4.96 | 80.2 | 1.61 | 0.70 |
| 2015 | 70 | 27.3 | 23.05 | 0.621 | 620 | 36.4 | 385 | 7.0 | 5.50 | 72.7 | 1.30 | 0.72 | |
| 3 | 2005 | 59 | 24.7 | 19.76 | 0.455 | 656 | 31.5 | 299 | 8.0 | 4.33 | 80.2 | 1.62 | 0.65 |
| 2015 | 70 | 26.0 | 20.60 | 0.523 | 612 | 32.5 | 320 | 7.0 | 4.57 | 69.3 | 1.18 | 0.65 | |
| 4 | 2005 | 120 | 31.2 | 22.63 | 0.798 | 472 | 36.2 | 377 | 6.5 | 2.90 | 76.2 | 1.44 | 0.68 |
| 2015 | 130 | 30.5 | 22.42 | 0.791 | 508 | 37.2 | 402 | 6.4 | 3.08 | 74.8 | 1.38 | 0.70 | |
| 5 | 2005 | 117 | 26.4 | 22.40 | 0.564 | 728 | 39.9 | 410 | 8.5 | 3.23 | 81.1 | 1.67 | 0.80 |
| 2015 | 128 | 27.8 | 23.91 | 0.662 | 656 | 39.7 | 434 | 7.1 | 3.39 | 70.4 | 1.22 | 0.78 | |
| Age average stand age, dbh mean quadratic breast height diameter, h mean height, v average tree volume, N number of trees per hectare, BA basal area, V stand volume, PAI periodic annual increment; MAI mean annual increment, CC canopy closure, CPA crown projection area, SDI stand density index | |||||||||||||
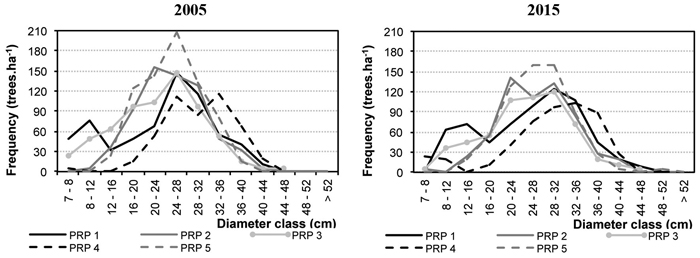
Fig. 2. Diameter distribution on the permanent research plots (PRP) 1–5 converted per ha in 2005 and 2015.
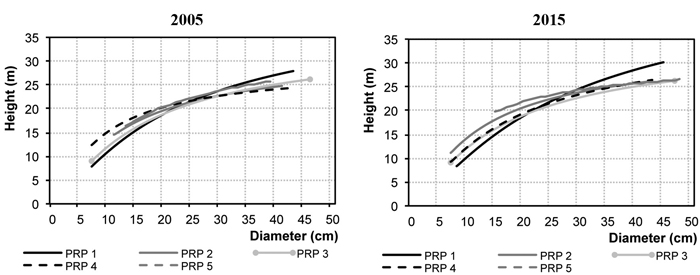
Fig. 3. Relationship between the height and diameter for the permanent research plots (PRP) 1–5 in 2005 and 2015.
| Table 4. Indices describing the structural, species and complex diversity of the tree layer on PRP 1–5 in 2005 and 2015. | |||||||||||
| PRP | Year | Indices | |||||||||
| R(C&Ei) | A(H&Si) | CS(D&Mi) | Ap(Pri) | TMd(Fi) | TMh(Fi) | K(J&Di) | H´(Si) | E(Pii) | B(J&Di) | ||
| 1 | 2005 | 1.105 | 0.496 | –0.048 | 0.400 | 0.349 | 0.304 | 2.809 | 0.163 | 0.271 | 8.022 |
| 2015 | 1.230* | 0.402* | –0.469* | 0.241 | 0.328 | 0.273 | 1.718 | 0.174 | 0.289 | 6.694 | |
| 2 | 2005 | 1.248* | 0.366* | –0.399* | 0.333 | 0.219 | 0.107 | 1.034 | 0.081 | 0.269 | 4.500 |
| 2015 | 1.264* | 0.350* | –0.604* | 0.269 | 0.229 | 0.099 | 2.310 | 0.062 | 0.130 | 6.469 | |
| 3 | 2005 | 1.198* | 0.403* | –0.378* | 0.407 | 0.289 | 0.191 | 1.486 | 0.145 | 0.241 | 6.211 |
| 2015 | 1.216* | 0.427 | –0.268 | 0.375 | 0.305 | 0.195 | 2.485 | 0.165 | 0.274 | 7.011 | |
| 4 | 2005 | 1.225* | 0.373* | –0.429* | 0.360 | 0.204 | 0.091 | 2.692 | 0.001 | 0.003 | 6.454 |
| 2015 | 1.205* | 0.419* | –0.271 | 0.322 | 0.307 | 0.187 | 1.706 | 0.012 | 0.025 | 5.791 | |
| 5 | 2005 | 1.268* | 0.345* | –0.496* | 0.595 | 0.194 | 0.094 | 0.579 | 0.000 | 0.000 | 2.923 |
| 2015 | 1.308* | 0.359* | –0.459* | 0.216 | 0.205 | 0.074 | 0.615 | 0.000 | 0.000 | 2.449 | |
| R aggregation index, A index of non-randomness, CS index of cluster size, Ap Arten-profil index, TMd diameter differentiation index, TMh height differentiation index, K crown differentiation index, H´ index of species heterogeneity, E index of species evenness, B stand diversity index; *statistically significant for horizontal structure (P < 0.05) | |||||||||||
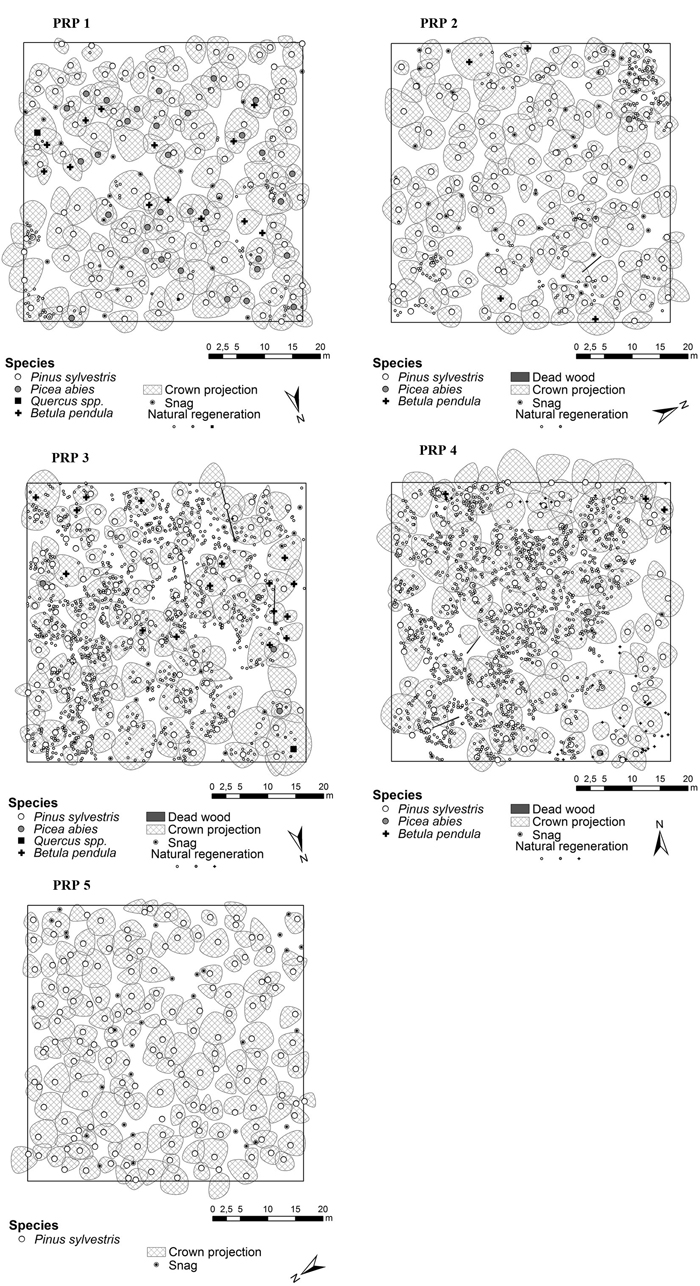
Fig. 4. Horizontal structure of the forest stands in Třebechovice locality on the permanent research plots (PRP 1–5) in 2015.
| Table 5. Numbers of recruits converted per ha, their percentage ratio and average height differentiated by tree species on the permanent research plots (PRP) 1–4. | ||||||||||||||||
| Species | Year | PRP 1 | PRP 2 | PRP 3 | PRP 4 | |||||||||||
| recruits ha–1 | % | cm | recruits ha–1 | % | cm | recruits ha–1 | % | cm | recruits ha–1 | % | cm | |||||
| Pinus sylvestris | 2005 | 44 | 69 | 142 | 116 | 94 | 117 | 1284 | 99 | 138 | 1448 | 97 | 162 | |||
| 2015 | 304 | 89 | 306 | 724 | 98 | 237 | 4080 | 99 | 298 | 4732 | 96 | 326 | ||||
| Picea abies | 2005 | 12 | 19 | 211 | 8 | 6 | 201 | 12 | 1 | 254 | 16 | 1 | 175 | |||
| 2015 | 36 | 10 | 371 | 12 | 2 | 421 | 40 | 1 | 420 | 32 | 1 | 380 | ||||
| Betula pendula | 2005 | 4 | 6 | - | 0 | 0 | - | 4 | 0 | 245 | 24 | 2 | 182 | |||
| 2015 | 0 | 0 | - | 0 | 0 | - | 4 | 0 | 435 | 176 | 3 | 392 | ||||
| Quercus petraea | 2005 | 4 | 6 | 122 | 0 | 0 | - | 0 | 0 | - | 0 | 0 | - | |||
| 2015 | 4 | 1 | 210 | 0 | 0 | - | 0 | 0 | - | 0 | 0 | - | ||||
| ∑ | 2005 | 64 | 100 | 147 | 124 | 100 | 118 | 1296 | 100 | 140 | 1492 | 100 | 167 | |||
| 2015 | 344 | 100 | 312 | 736 | 100 | 240 | 4124 | 100 | 300 | 4940 | 100 | 330 | ||||
| On PRP 5 no natural regeneration in the study period was present | ||||||||||||||||
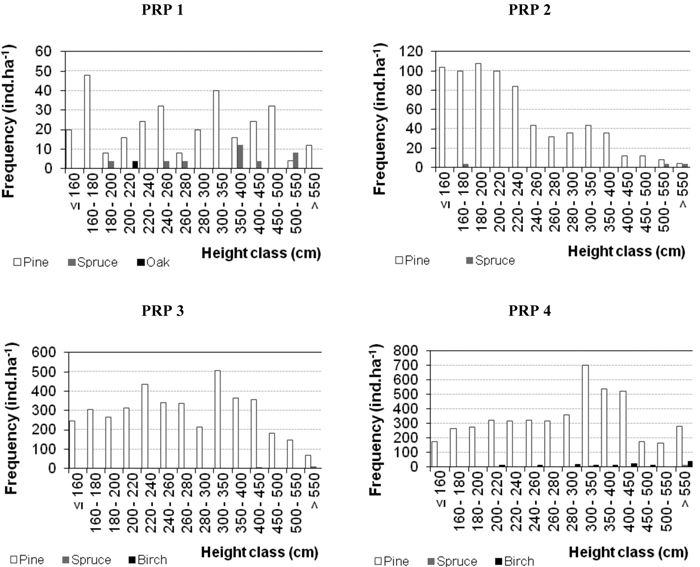
Fig. 5. Histograms of the height structure of natural regeneration on the permanent research plots (PRP) 1–4 differentiated by tree species and converted per ha in 2015.
| Table 6. Indices describing the horizontal structure of natural regeneration on the permanent research plots (PRP) 1–4 in 2015. | ||||
| Index | PRP 1 | PRP 2 | PRP 3 | PRP 4 |
| Hopkins–Skellam A | 0.742* | 0.923* | 0.776* | 0.890* |
| Clark–Evans R | 0.627* | 0.492* | 0.783* | 0.738* |
| David–Moore DM | 3.652* | 6.320* | 4.140* | 5.195* |
| * Statistically significant (P < 0.05) | ||||
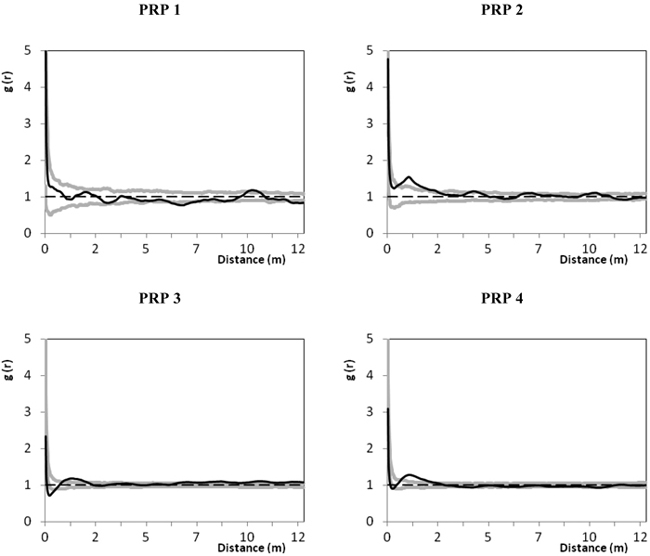
Fig. 6. Spatial relations of natural regeneration and the tree layer on the permanent research plots (PRP) 1–4 represented by the pair correlation function; the black line depicts the pair correlation function g(r) for real distances between individuals on the permanent research plots (PRP); two grey curves illustrate the 95% confidence interval for the random spatial pattern; r – radius defining distance between the selected points (trees and nature regeneration); g(r) > 1 indicates a clustering at distances r, while g(r) < 1 indicates a regularity in the respective distances r.
| Table 7. Chronologies characteristics including mean increment, Explained proportion of Signal (EPS) autocorrelation values before and after standardization and dendrometric characteristics of sampled trees on the permanent research plots (PRP) 1–5. | |||||||||
| PRP | Mean increment (mm) | Explained proportion of signal | Autocorrelation value before standardization | Autocorrelation value after standardization | Length in age 80 (cm) | Min. dbh* (cm) | Max. dbh* (cm) | Min. height (m) | Max. height (m) |
| 1 | 1.88516 | 0.874 | 0.7738 | 0.5116 | 11.38 | 24.2 | 33.3 | 24.9 | 27.5 |
| 2 | 1.65091 | 0.864 | 0.7481 | 0.5098 | 11.75 | 21.6 | 35.7 | 22.0 | 26.4 |
| 3 | 1.61937 | 0.685 | 0.7059 | 0.5577 | 11.40 | 20.0 | 36.7 | 20.4 | 25.5 |
| 4 | 1.07536 | 0.885 | 0.7123 | 0.6065 | 7.84 | 22.6 | 36.9 | 21.2 | 25.1 |
| 5 | 1.25056 | 0.879 | 0.7288 | 0.6109 | 8.46 | 24.1 | 36.4 | 24.8 | 26.9 |
| * Breast height diameter without bark | |||||||||
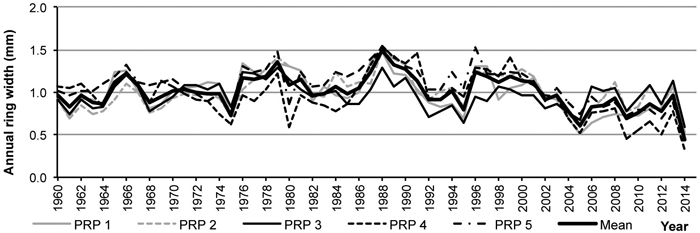
Fig. 7. Average tree-ring series from the permanent research plots (PRP) 1–5 and in total after age detrending.
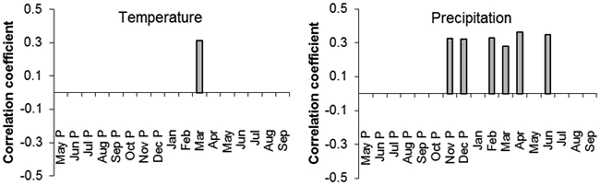
Fig. 8. The values of correlation coefficients of the regional standardized tree-ring chronology with the monthly temperature (left) and precipitation (right) from May of the previous year (P) to September of the current year for the period 1963–2014. Only correlation coefficients with statistically significant values (α = 0.05 %) are displayed.
| Table 8. Correlations between radial growth increment with climatic data (1963–2014) and air pollution factors (1984–2014; AOT40F 1996–2014) and health status (2005–2014). Significant correlations (P < 0.05) are indicated in bold. | ||||||||||||
| SO2 mean | SO2 veg | SO2 nonveg | NOx mean | NOx veg | NOx nonveg | AOT40F | S depos | N depos | Temp ActAnn | Temp ActVeg | Temp PrevVeg | |
| Foliation | –0.66 | –0.46 | –0.29 | –0.29 | –0.35 | –0.24 | –0.49 | –0.45 | –0.69 | –0.01 | 0.08 | 0.60 |
| Increment | 0.17 | 0.11 | 0.22 | 0.42 | 0.19 | 0.04 | 0.37 | 0.24 | 0.27 | –0.26 | –0.34 | –0.33 |
| Temp ActV-VIII | Temp PrevV-VIII | Temp ActI-III | Temp Nonveg | Prec ActSum | Prec ActVeg | Prec PrevVeg | Prec ActV-VIII | Prec PrevV-VIII | Prec ActI-III | Prec Nonveg | Incre- ment | |
| Foliation | 0.50 | 0.71 | 0.13 | –0.10 | –0.15 | –0.03 | 0.48 | –0.13 | 0.63 | –0.25 | –0.12 | 0.88 |
| Increment | –0.22 | –0.29 | –0.00 | –0.87 | 0.17 | 0.01 | 0.17 | –0.07 | 0.10 | 0.11 | 0.09 | 1.00 |
| SO2mean mean annual SO2 concentration, SO2veg mean SO2 concentrations in vegetation season, SO2nonveg mean SO2 concentrations in nonvegetation season, NOx, AOT40F ozone exposure, Sdepos annual S deposition, Ndepos annual N deposition, TempActAnn mean annual temperature, TempActVeg mean temperature in the current vegetation season, TempPrevtVeg mean temperature in the previous vegetation season, TempActV-VIII mean temperature in May–August of the given year, TempPrevV-VIII mean temperature in May–August of the previous year, TempActI-III mean temperature in January–March of the given year, TempNonveg mean temperature in the nonvegetation season; Prec sum of precipitation | ||||||||||||