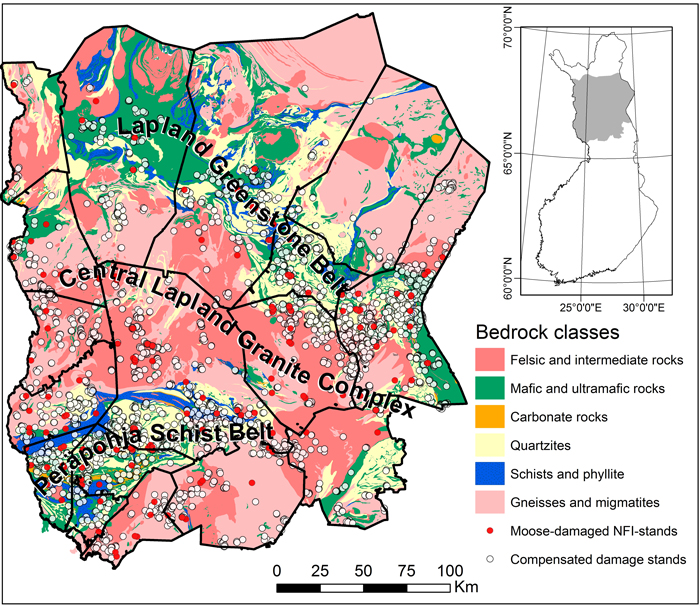
Fig. 1. Bedrock map (a) of the study area in Finnish Lapland, generalized from the Digital bedrock map (1:200 000©, Geological Survey of Finland). Individual rocks were robustly classified to six groups according to their origin and features (see Koljonen 1992). Gneisses and migmatites are grouped into one class independent of their origin. Three major lithological provinces exist in the study area: Lapland Greenstone Belt (LGB), Peräpohja Schist Belt (PSB) and Central Lapland Granitoid Complex (CLGC). Compensated moose damage stands are marked on the map with white symbols and moose-damaged stands investigated in the National Forest Inventory with red labels. Basemap©, the National Land Survey of Finland.
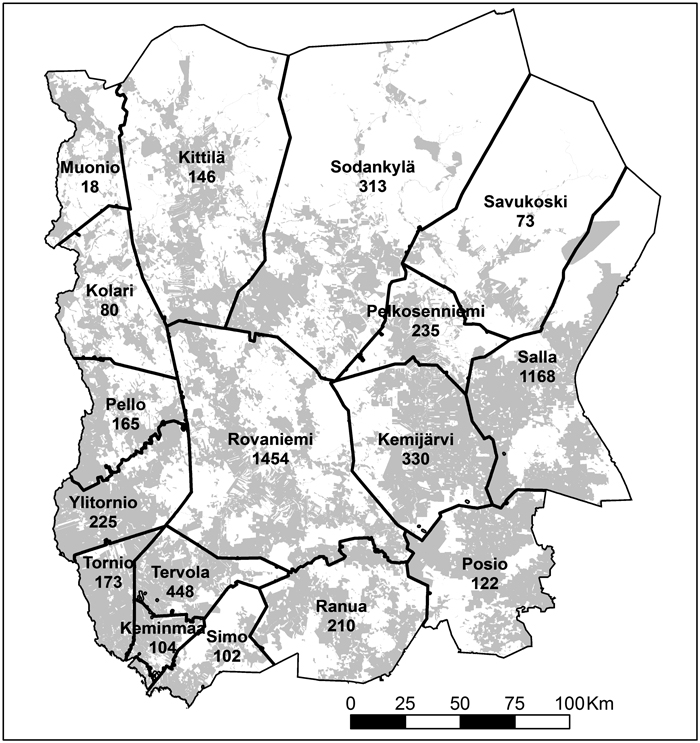
Fig. 2. Municipalities, the number of compensated damage stands in each municipality and private land (grey) in the study area.
| Table 1. The proportions of forest site types and the main tree species among compensated moose damage stands and NFI-stands in Finnish Lapland. | |||
| Forest type | Control NFI-stands | Compensated stands | Damaged NFI-stands |
| Herb-rich | 1.7a | 0.0b | 1.4a |
| Herb-rich heath | 10.2a | 1.8b | 7.2a |
| Mesic heath | 44.4a | 54b | 62.4c |
| Sub-xeric heath | 39.3a | 43.8b | 25c |
| Xeric heath | 4.2a | 0.4b | 3.6a |
| Barren heath | 0.2a | 0.0b | 0.4a |
| Main tree species | |||
| Scots pine | 77.3a | 99.2b | 86c |
| Norway spruce | 10.7a | 0.4b | 7.5a |
| Birch (Betula sp.) | 11.9a | 0.0b | 4.3c |
| Aspen | 0.0a | 0.3b | 2.2c |
| Alder (Alnus sp.) | 0.0a | 0.1a | 0.0a |
| Other | 0.1a | 0.0a | 0.0a |
| a,b,c Statistically significant differences between treatment groups. | |||
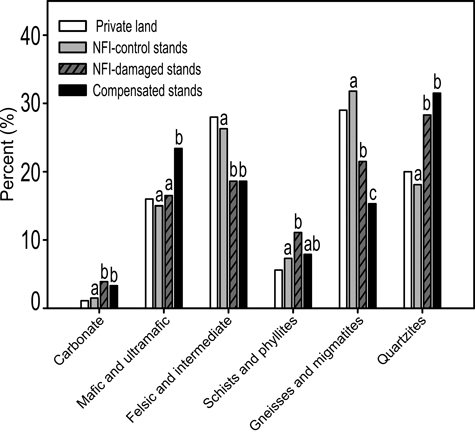
Fig. 3. Proportion of different rock classes in private land, NFI-control stands, NFI-damage stands and compensated moose damage stands. Statistically significant (P ≤ 0.05) differences are marked with different letters. The proportions of private land were not tested but they were used as a control for the proportions of NFI-control stands.
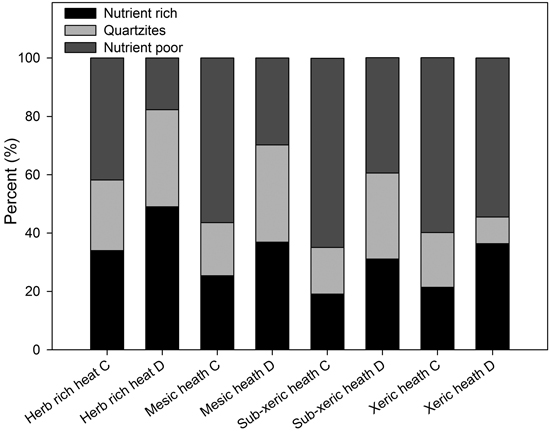
Fig. 4. The proportions of nutrient-rich (carbonate, mafic and ultramafic rocks, schists and phyllite), nutrient-poor (felsic and intermediate rocks, gneisses and migmatites) and quartzites in different site types representing different fertility class and moose damage status (C = NFI-control stands, D = compensated moose damage stands).
| Table 2. Distribution of superficial deposits in undamaged NFI-stands (control) and compensated moose damage stands in Finnish Lapland. | ||||
| Proportion of superficial deposits (%) | ||||
| Surface soil | Subsoil | |||
| Soil type | NFI-Control stands | Compensated damage stands | NFI-Control stands | Compensated damage stands |
| Fine-grained stratified | 1.2a | 0.5b | 1.8a | 0.6b |
| Coarse-grained stratified | 10.4a | 6.5b | 10.8a | 6.8b |
| Rocky | 4.0a | 2.2b | 4.0a | 2.1b |
| Non-stratified | 63.7a | 81.5b | 70.3a | 85.2b |
| Peat deposits | 20.6a | 9.3b | 13.1b | 5.2b |
| a,b Statistically significant differences between treatment groups. | ||||
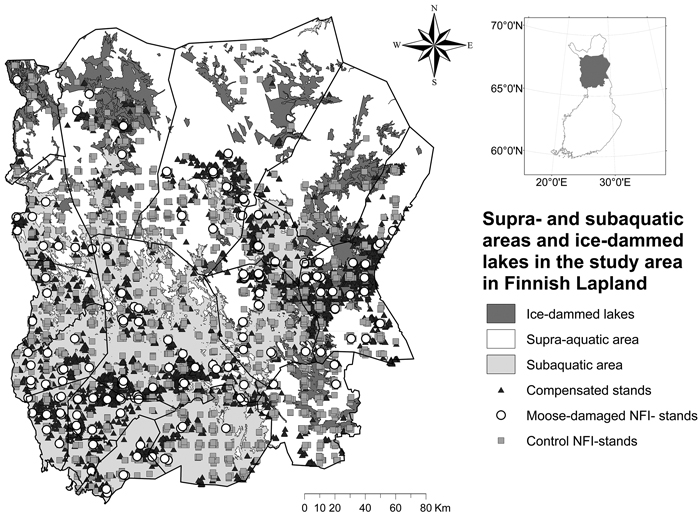
Fig. 5. Location of compensated moose damage, NFI-control and NFI-damage stands in relation to the location of subaquatic and supra-aquatic areas in Finnish Lapland. Subaquatic areas represent the highest shoreline ca. 7000–9000 BP (Ojala et al. 2013). Ancient Shoreline Database©, Geological Survey of Finland; Basemap©, the National Land Survey of Finland.
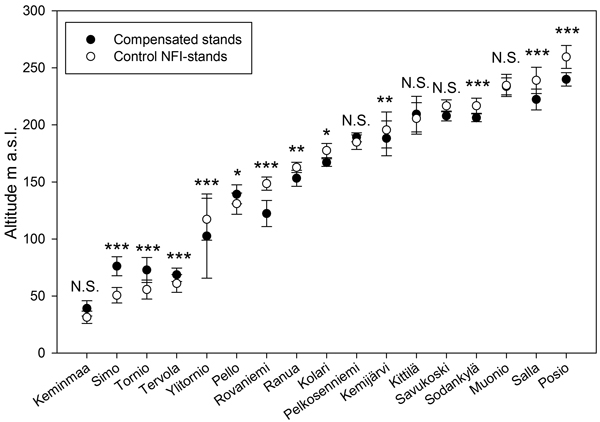
Fig. 6. The average altitudes (m a.s.l.) and S.D. of compensated moose damage and NFI-control stands in the municipalities (see Fig. 1) of the study area in Finnish Lapland. Statistical significances between groups: *** = p < 0.001, ** = p < 0.01, * = p < 0.05 and N.S = p > 0.05.