| Table 1. The multi-level binomial model (Model 1) estimated for the mean percentage coverage of bilberry on the 2 m2 quadrates in the stands of the PSP3000 data. Sites I–V and VII–VIII refer to different site quality classes (see Suppl. file 1). Mineral soils, spruce mires and pine mires pertain to forest land, i.e. categories (a–e) of this study. | |||||
| Variable | Estimate | Std error | t-value | Odds ratio | p-value |
| Intercept | –4.3356 | 0.0934 | –46.44 | 0.013 | < 0.001 |
| Site (ref. III, mineral soils) a | |||||
| site I, mineral soils | –2.4140 | 0.1708 | –14.14 | 0.089 | < 0.001 |
| site II, mineral soils | –0.5627 | 0.0630 | –8.93 | 0.570 | < 0.001 |
| site IV, mineral soils | –0.4702 | 0.0513 | –9.17 | 0.625 | < 0.001 |
| site V, mineral soils | –1.6286 | 0.1085 | –15.01 | 0.196 | < 0.001 |
| site VII, mineral soils | –1.3500 | 0.2149 | –6.28 | 0.259 | < 0.001 |
| sites ≤ II, spruce mires | –1.1044 | 0.1173 | –9.41 | 0.331 | < 0.001 |
| sites ≤ III, pine mires | –0.4081 | 0.1220 | –3.35 | 0.665 | 0.001 |
| site IV, pine mires | –0.2592 | 0.0812 | –3.19 | 0.772 | 0.002 |
| site V, pine mires | –1.0210 | 0.0922 | –11.08 | 0.360 | < 0.001 |
| site VIII, poorly productive land | 1.1348 | 0.1893 | 6.00 | 3.111 | < 0.001 |
| ArtificialRegen b, mineral soils | –0.2713 | 0.0500 | –5.42 | 0.762 | < 0.001 |
| FormerAgrLand c, mineral soils | –1.7342 | 0.1468 | –11.81 | 0.177 | < 0.001 |
| Spruce d, mineral soils | –0.1196 | 0.0522 | –2.29 | 0.887 | 0.023 |
| Deciduous trees d on sites I and II, mineral soils | –0.7146 | 0.1123 | –6.37 | 0.489 | < 0.001 |
| Deciduous trees d, spruce mires | –0.7355 | 0.1246 | –5.90 | 0.479 | < 0.001 |
| Altitude (m) | 0.0040 | 0.0005 | 8.06 | 1.004 | < 0.001 |
| Altitude2/100 (m), poorly productive and waste land | –0.0004 | 0.0001 | –3.97 | 0.999 | < 0.001 |
| Stand age (a), mineral soils | 0.0094 | 0.0011 | 8.43 | 1.009 | < 0.001 |
| Stand age2/100 (a), mineral soils | –0.0027 | 0.0005 | –5.32 | 0.997 | < 0.001 |
| Stand basal area (m2 ha–1), forest land e | 0.1071 | 0.0055 | 19.35 | 1.113 | < 0.001 |
| Stand basal area2/100 (m2 ha–1), forest land e | –0.2050 | 0.0151 | –13.59 | 0.815 | < 0.001 |
| Variance components at f | |||||
| forestry centre region level | 0.0187 | (14) | |||
| municipality level | 0.1279 | (367) | |||
| cluster level | 0.1328 | (983) | |||
| sample plot level | 0.1585 | (2515) | |||
| stand level (‘pseudo’ level) | 0.4913 | (2801) | |||
| a The parameter estimates of site variables “site III, spruce mires”, “site IV, spruce mires” and “site VIII, waste land” were not statistically significant. b ArtificialRegen (artificial regeneration) is an indicator variable for the regeneration method (ref. natural regeneration). c FormerAgrLand (former agricultural land) is an indicator variable for stand history (ref. former forest). d An indicator variable for the dominant tree species (the reference is other tree species). e In this context, forest land refers to categories (a–e) of this study. f The number of observations at each level is given in parentheses. A random term at ‘pseudo’ level accounts for the overdispersion. | |||||
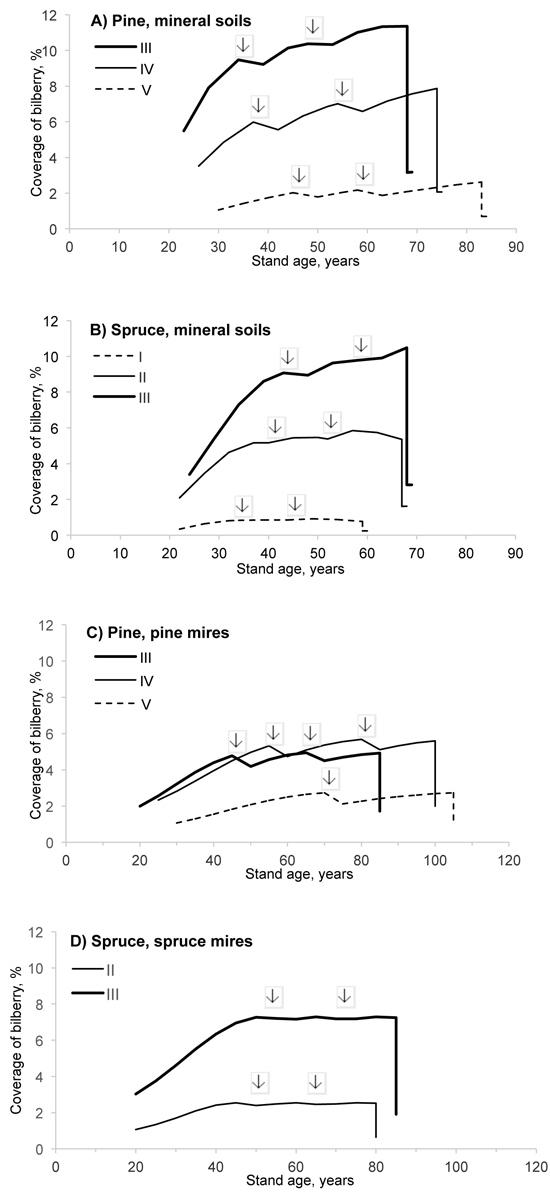
Fig. 1. Predicted coverage of bilberry in pine and spruce stands of different site fertilities (i.e. sites I–V; see the definitions in Suppl. file 1). The development of stands, representing mineral soils (A, B), pine mires (C) and spruce mires (D) in southern Finland, was simulated using the Motti simulator (arrows indicate thinnings).
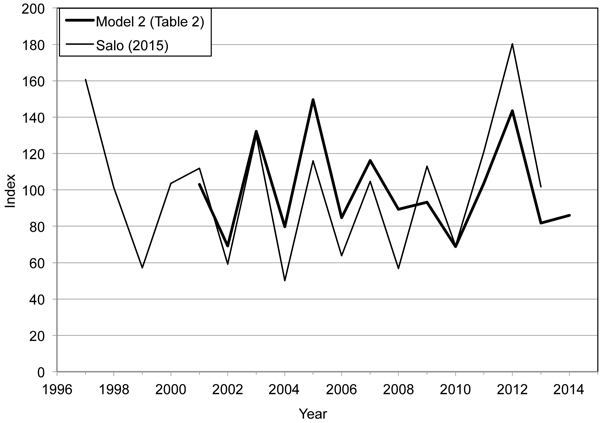
Fig. 2. Bilberry yield indices calculated on the basis of Model 2 (Table 2) and mean annual bilberry yields (kg ha–1) presented by Salo (2015). The former index series covers years 2001–2014 and the latter one years 1997–2013. In both series, the mean value of the indices is 100.
| Table 2. The multi-level Poisson model (Model 2) estimated for the mean number of bilberries on five 1 m2 quadrates in MASI stands, measured in 2001–2014. | ||||
| Variable | Estimate | Std error | t-value | p-value |
| Intercept | 4.4549 | 0.7005 | 6.36 | <0.001 |
| Year effect (ref. 2006) | ||||
| 2001 | 0.1960 | 0.1719 | 1.14 | 0.256 |
| 2002 | –0.2007 | 0.1806 | –1.11 | 0.268 |
| 2003 | 0.4469 | 0.1708 | 2.62 | 0.009 |
| 2004 | –0.0602 | 0.1681 | –0.36 | 0.721 |
| 2005 | 0.5694 | 0.1622 | 3.51 | 0.001 |
| 2007 | 0.3161 | 0.1708 | 1.85 | 0.066 |
| 2008 | 0.0533 | 0.1647 | 0.32 | 0.747 |
| 2009 | 0.0960 | 0.1598 | 0.60 | 0.549 |
| 2010 | –0.2072 | 0.1612 | –1.29 | 0.200 |
| 2011 | 0.2025 | 0.1569 | 1.29 | 0.198 |
| 2012 | 0.5280 | 0.1632 | 3.24 | 0.001 |
| 2013 | –0.0334 | 0.1723 | –0.19 | 0.846 |
| 2014 | 0.0164 | 0.1788 | 0.09 | 0.927 |
| Coverage of bilberry, % | 0.0135 | 0.0057 | 2.38 | 0.028 |
| 1000/Temperature sum (dd) | –1.0888 | 0.5101 | –2.13 | 0.050 |
| Variance components at a | ||||
| forestry centre region level | <0.0001 | (13) | ||
| municipality level | 0.1235 | (29) | ||
| stand level | 0.1132 | (50) | ||
| stand × year level (‘pseudo’ level) | 0.2656 | (306) | ||
| a The number of observations at each level is given in parentheses. A random term at ‘pseudo’ level accounts for the overdispersion. | ||||