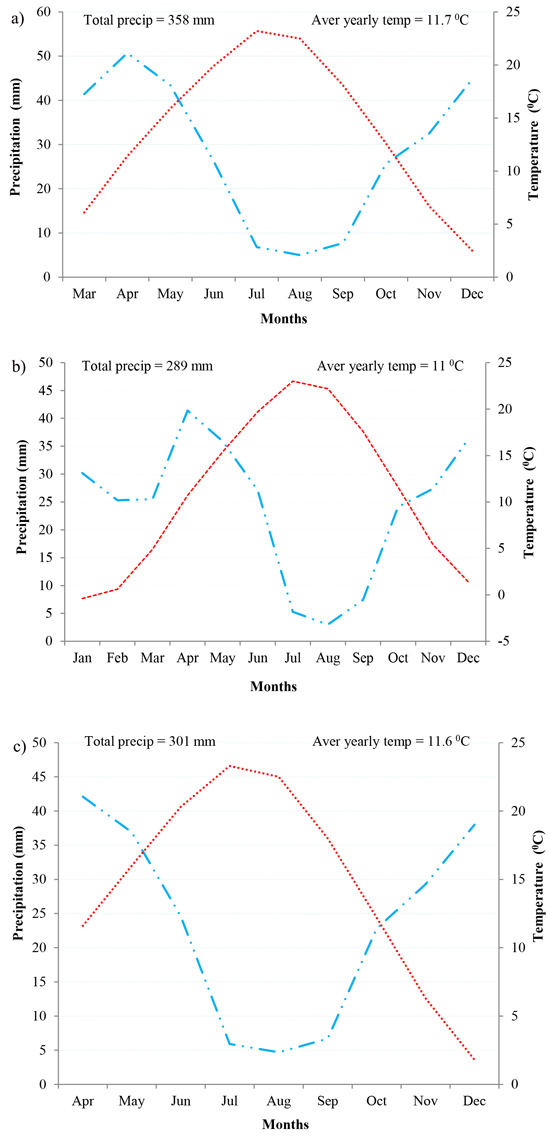
Fig. 1. Walter diagram for Aksaray (a), Kayalı (b) and Ereğli (c) experimental sites used for studying effects of soil amendments on saline-sodic soils in the Central Anatolian region of Turkey.
| Table 1. Soil properties (Averages, N = 15) of the experimental sites before treatments applied for studying effects of soil amendments on saline-sodic soils in the Central Anatolian region of Turkey. CEC = cation exchange capacity; ESP = exchangeable sodium percentage; EC = electrical conductivity. | |||||||
| Sites | Soil texture type | pH | CEC (cmolc kg–1) | ESP (%) | Total calcite (CaCO3 %) | Soil bulk density (g cm–3) | EC (dS m–1) |
| Aksaray | Clay loam | 8.3 | 38 | 36 | 7 | 1.28 | 6 |
| Ereğli | Clay | 8.7 | 39 | 38 | 49 | 1.30 | 7 |
| Kayalı | Loamy clay | 8.3 | 34 | 43 | 23 | 1.36 | 10 |
| Table 2. Amounts of soil amendments used for studying effects of soil amendments on saline-sodic soils in the Central Anatolian region of Turkey. ESP = exchangeable sodium percentage. | ||||
| Sites | Target ESP (%) | Soil depth (cm) | Gypsum applied (kg m–2) | Sulfur applied (kg m–2) |
| Aksaray | 10 | 100 | 10.9 | 2.0 |
| Ereğli | 10 | 100 | 11.0 | 2.1 |
| Kayalı | 10 | 100 | 13.1 | 2.4 |
| Table 3. Median and range of soil pH and means and standard errors of exchangeable sodium percentage (ESP) values two years after treatments (N = 4) applied for studying effects of soil amendments on saline-sodic soils in the Central Anatolian region of Turkey. The results of an analysis of variance in randomized block design were considered significant at P < 0.05. Means with a common lowercase letter are not significantly different at alpha = 0.05 according to Tukey’s HSD test. | ||
| Soil chemical treatments | pH | ESP (%) |
| Gypsum | 7.9 ± 0.35a | 16 ± 6b |
| Sulfur | 7.77 ± 0.32a | 15 ± 4b |
| Control | 8.16 ± 0.25a | 33 ± 6a |
| No-tillage | 7.97 ± 0.21a | 32 ± 5a |
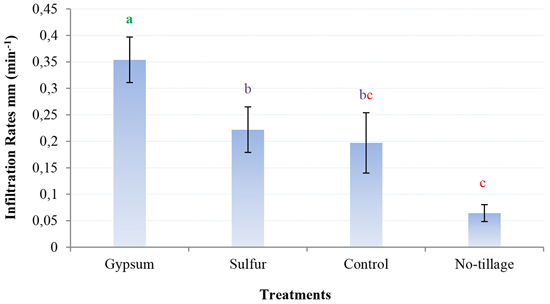
Fig. 2. Mean and standard error (S.E.) of infiltration rates after two years under different treatments (N = 4) applied for studying effects of soil amendments on saline-sodic soils in the Central Anatolian region of Turkey. The results of the analysis of variance (ANOVA) procedure for randomized block design were considered significant at P < 0.05. Means with a common lowercase letter are not significantly different at alpha = 0.05 according to Tukey’s HSD test.
| Table 4. Means and standard errors of seedling survival rates (%) under different treatments (N = 3) applied for studying effects of soil amendments on saline-sodic soils in the Central Anatolian region of Turkey. The results of an analysis of variance in randomized block design were considered significant at P < 0.05. Means with a common lowercase letter are not significantly different at alpha = 0.05 according to Tukey’s HSD test. | |||
| Species | Treatments | ||
| Gypsum | Sulfur | Control | |
| Russian olive | 93 ± 5a | 91 ± 5a | 64 ± 21b |
| Salt cedar | 86 ± 6a | 76 ± 14a | 80 ± 9a |
| Silver poplar | 43 ± 16a | 41 ± 3a | 25 ± 12a |
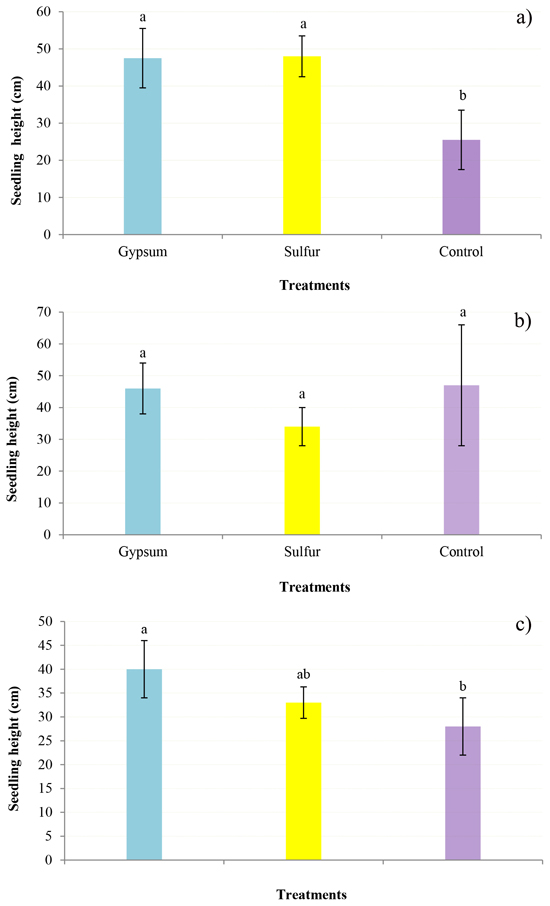
Fig. 3. Mean and standard error (S.E.) of E. angustifolia (a), T. smyrnensis (b) and P. alba (c) height growth after two years under different treatments (N = 3) applied for studying effects of soil amendments on saline-sodic soils in the Central Anatolian region of Turkey. The results of the analysis of variance (ANOVA) procedure for randomized block design were considered significant at P < 0.05. Means with a common lowercase letter are not significantly different at alpha = 0.05 according to Tukey’s HSD test.
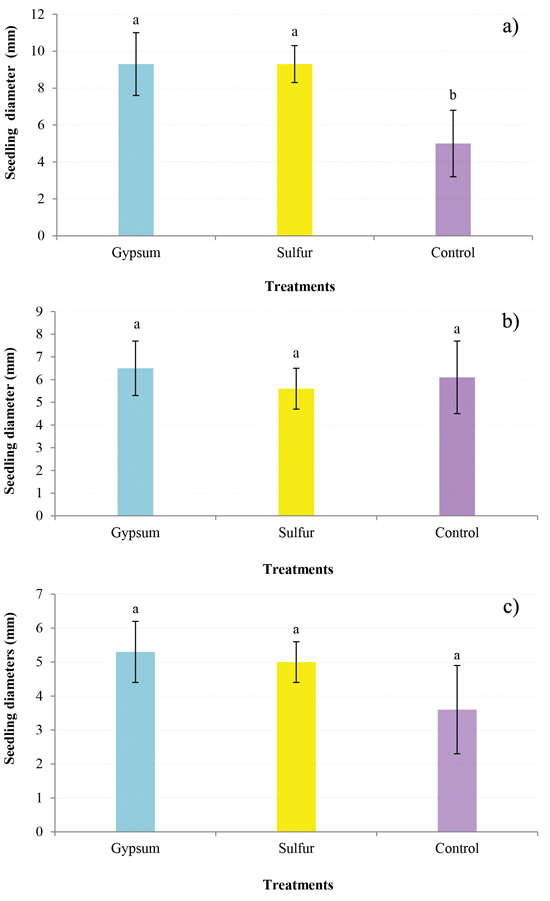
Fig. 4. Mean and standard error (S.E.) of E. angustifolia (a), T. smyrnensis (b) and P. alba (c) diameter growth after two years under different treatments (N = 3) applied for studying effects of soil amendments on saline-sodic soils in the Central Anatolian region of Turkey. The results of the analysis of variance (ANOVA) procedure for randomized block design were considered significant at P < 0.05. Means with a common lowercase letter are not significantly different at alpha = 0.05 according to Tukey’s HSD test.