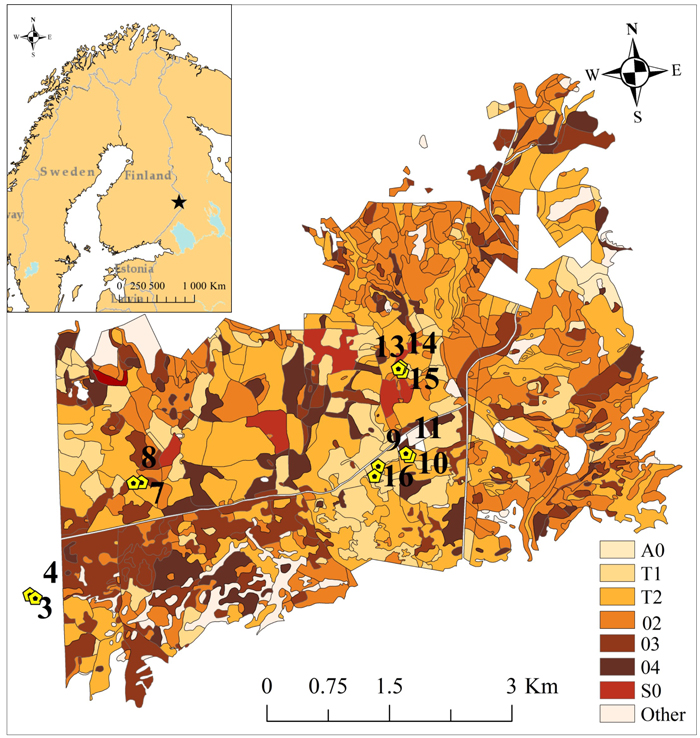
Fig. 1. The study area with 11 sampling plots is located in easternmost Finland. Sampling plots were established in 2002 in a wider study area covering approximately 34.5 square kilometers. (A0 = Open regeneration area, T1 = Small-seedling stand, T2 = Advanced seedling stand, 02 = Young thinning stand, 03 = Advanced thinning stand, 04 = Mature stand, S0 = Seed-tree stand, and Other = other types of forest stands). Basemap© Esri; DeLorme Publishing company Inc.; OpenStreetMap contributors and the GIS user community.
| Table 1. Inventoried stand characteristics of the sampling plots in 2010, mean height (H02 & H10), and diameter-at-breast-height (DBH02 & DBH10) in 2002 and 2010. (r = radius of plot, n/plot = number of trees per plot, n/ha = number of trees per hectare, BA = basal area (m2/ha), Age = plot-wise age (±SD), H = mean height (±SD), DBH = mean diameter-at-breast-height (±SD), DEF = plot-wise defoliation intensity, proportion of M = Moss, L = Lichen, VM = Vaccinium myrthillus, VV = Vaccinium vitis-idaea, CV = Calluna vulgaris, Other = other plant species and Humus = depth of humus layer). | |||||||||
| Plot ID | r (m) | n/plot | n/ha | BA | Age | H02 (m) | DBH02 (cm) | H10 (m) | DBH10 (cm) |
| 3 | 12 | 21 | 464 | 21 | 75 (9.4) | 19.4 (2.0) | 22.6 (4.0) | 20.9 (1.8) | 24.0 (4.1) |
| 4 | 12 | 20 | 442 | 20 | 72 (12.0) | 17.6 (1.2) | 21.9 (3.0) | 19.1 (1.4) | 24.0 (3.1) |
| 7 | 9 | 22 | 865 | 31 | 86 (9.3) | 17.6 (2.0) | 18.9 (4.5) | 20.0 (1.7) | 20.0 (4.7) |
| 8 | 9 | 21 | 826 | 24 | 85(4.4) | 16.3 (1.6) | 17.4 (2.6) | 17.8 (0.9) | 19.1 (2.7) |
| 9 | 12 | 21 | 464 | 10 | 59 (3.6) | 15.4 (1.4) | 17.7 (3.1) | 15.4 (1.4) | 18.4 (2.3) |
| 10 | 11 | 18 | 474 | 18 | 75 (14.3) | 16.5 (2.7) | 19.5 (4.6) | 17.7 (3.9) | 20.3 (4.6) |
| 11 | 12 | 26 | 575 | 22 | 71 (8.4) | 16.9 (2.4) | 20.5 (3.8) | 18.3 (1.6) | 21.4 (4.0) |
| 13 | 11 | 20 | 526 | 22 | 80 (7.6) | 17.8 (2.6) | 19.6 (4.5) | 20.1 (1.1) | 20.7 (4.9) |
| 14 | 10 | 24 | 764 | 29 | 84 (17.9) | 18.0 (2.7) | 18.9 (4.8) | 18.5 (2.8) | 21.1 (5.7) |
| 15 | 8.5 | 24 | 1057 | 24 | 80 (11.6) | 15.2 (2.3) | 15.1 (3.6) | 17.6 (1.0) | 16.5 (4.1) |
| 16 | 12 | 20 | 442 | 16 | 73 (4.8) | 17.6 (1.6) | 21.1 (3.5) | 17.8 (1.7) | 21.3 (3.9) |
| Plot ID | DEF(%) | M (%) | L (%) | VM (%) | VV (%) | CV (%) | Other (%) | Humus (cm) | |
| 3 | 8.86 | 58.8 | 13.8 | 6.3 | 18.8 | 0 | 2.5 | 2.5 | |
| 4 | 6.51 | 48.3 | 31.7 | 0 | 8.3 | 11.7 | 0 | 2.5 | |
| 7 | 4.34 | 53 | 7 | 9 | 6 | 20 | 4 | 2.5 | |
| 8 | 3.88 | 60 | 16 | 2 | 10 | 12 | 0 | 4.5 | |
| 9 | 76 | 51 | 13 | 5 | 26 | 5 | 0 | 4 | |
| 10 | 26.48 | 58 | 6 | 10 | 22 | 3 | 1 | 5.2 | |
| 11 | 38.24 | 63 | 11 | 11 | 13 | 2 | 0 | 4.2 | |
| 13 | 5.58 | 63 | 22 | 4 | 11 | 0 | 0 | 3 | |
| 14 | 2.31 | 54 | 19.7 | 11.7 | 14.7 | 0 | 0 | 4.5 | |
| 15 | 0.69 | 54 | 13 | 14 | 15 | 4 | 0 | 3 | |
| 16 | 77.22 | 61.3 | 6.3 | 6.3 | 20 | 6.3 | 0 | 4.5 | |
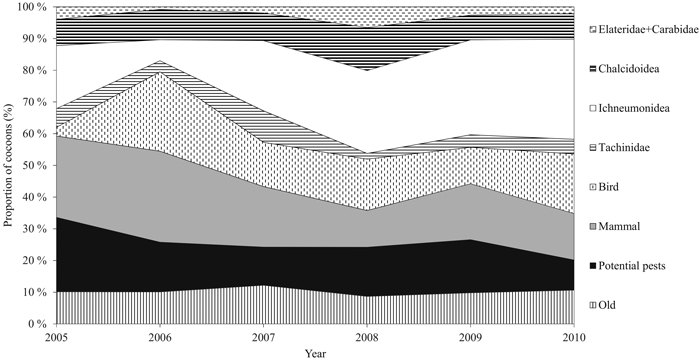
Fig. 2. Annual relative proportion (%) of the cocoon groups during the study period. The group of potential pests includes new hatched and diapausing cocoons. Families Carabidae and Elateridae are combined. Predation includes groups of small mammals, birds, and Carabidae and Elateridae. Parasitism consists of families Tachinidae, Ichneumonidae, and Chalcidoidea. View larger in new window/tab.
| Table 2. Results of the non-parametric Friedman test for the different cocoon mortality groups between years (2005–2010) (threshold of significance p < 0.05, df = 5), and the number of pairs of years (N of years) that showed statistically significant difference for a certain cocoon group after Bonferroni correction (Nemenyi post hoc test, p < 0.05). | |||
| Group | Friedman chi-squared | p-value | N of years |
| Old hatched | 4.14 | 0.529 | 0 |
| Potential pests | 21.03 | 0.001 | 1 |
| Small mammals | 20.19 | 0.001 | 0 |
| Birds | 35.65 | 0.000 | 2 |
| Tachinidae | 10.09 | 0.073 | 0 |
| Ichneumonidae | 33.49 | 0.000 | 2 |
| Chalcidoidea | 4.84 | 0.435 | 0 |
| Elateridae + Carabidae | 13.03 | 0.023 | 0 |
| Parasitism | 24.35 | 0.000 | 2 |
| Predation | 23.94 | 0.000 | 3 |
| Natural enemy complex | 17.70 | 0.003 | 1 |
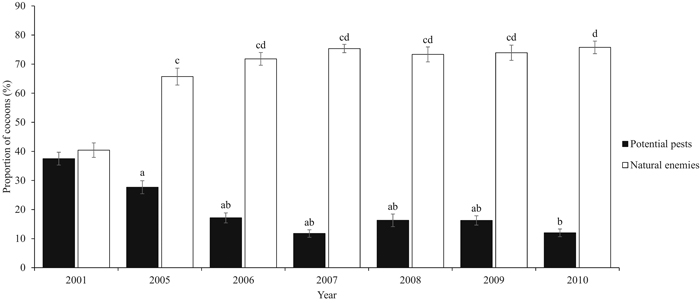
Fig. 3. Proportion (%, ±SE) of the potential pests (2001 hatched and intact cocoons and 2005–2010 new hatched and diapausing cocoons) and natural enemies (parasitoids and predators). Natural enemies cover birds and small mammals, and the Ichneumonidae, Chalcidoidea, Tachinidae, Elateridae, and Carabidae families. Our study period covers years 2005–2010. Data from year 2001 are from De Somviele et al. (2007), and are not included into the statistical tests because of the different sampling method and larger variation in site types. Letters indicate statistical differences (p < 0.05) separately for both series. View larger in new window/tab.
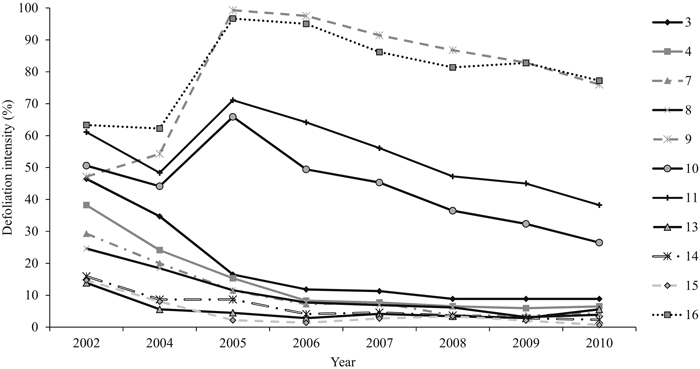
Fig. 4. The mean defoliation intensity (%) of each sampling plot between 2002 and 2010. On four sampling plots (9, 10, 11, and 16), the peak defoliation was met in 2005 and in other plots in 2002. View larger in new window/tab.
Fig. 5. The importance of various tree and environmental features in classifying the mean parasitism and predation level in 2010 using Random Forests. Results of the run, in which tree features were used to predict parasitism (a) and predation (c). Results of the run conducted with the environmental features to predict parasitism (b) and predation (d). Higher values indicate a higher importance of a feature. (Height = mean height in 2010 (m), Dbh = diameter-at-breast-height in 2010 (cm), Trees/ha = number of trees per hectare, Basal area = basal area in m2 per hectare, Defoliation = plot-wise mean defoliation in 2010, forest floor vegetation characteristics in proportions in 2010). View larger in new window/tab.
| Table 3. Spearman’s correlation coefficient was used to calculate the correlation coefficient (threshold of significance p < 0.05) between environmental characteristics and cocoon parasitism and predation in 2010. (DBH = mean diameter-at-breast-height, BA = plot-wise basal area, DEF = plot-wise defoliation intensity, VM = Vaccinium myrthillus, VV = Vaccinium vitis-idaea, CV = Calluna vulgaris). | ||||
| Parasitism | Predation | |||
| Variabel | Correlation | p-value | Correlation | p-value |
| Mean DBH (cm) | –0.450 | 0.136 | 0.530 | 0.095 |
| Trees/ha | –0.100 | 0.769 | 0.350 | 0.289 |
| Mean height (m) | –0.340 | 0.031 | 0.190 | 0.573 |
| Mean age | –0.350 | 0.289 | 0.566 | 0.070 |
| BA (m2/ha) | –0.470 | 0.140 | 0.289 | 0.021 |
| Mean DEF (%) | 0.270 | 0.417 | –0.730 | 0.011 |
| Moss (%) | 0.250 | 0.465 | –0.450 | 0.168 |
| Lichen (%) | –0.080 | 0.811 | 0.510 | 0.113 |
| CV (%) | –0.220 | 0.515 | 0.160 | 0.647 |
| VM (%) | –0.190 | 0.573 | 0.030 | 0.926 |
| VV (%) | 0.450 | 0.170 | –0.740 | 0.010 |
| Humus (cm) | 0.360 | 0.281 | –0.570 | 0.067 |