| Table 1. Soil characteristics in 18-year-old silver birch stand in upper 0–10 cm soil layer. Average ± standard error is presented. | |
| Soil characteristics | |
| N, % | 0.110 ± 0.002 |
| P, mg kg–1 | 78.3 ± 2.3 |
| K, mg kg–1 | 280.3 ± 3.6 |
| Ca, mg kg–1 | 504.0 ± 21.7 |
| Mg, mg kg–1 | 79.5 ± 7.1 |
| C, % | 1.42 ± 0.07 |
| pH | 5.69 ± 0.03 |
| Bulk density, g cm–3 | 1.34 ± 0.02 |
| Texture | Loamy sand |
| Table 2. Parameter estimates of the regression Eq. 1 for estimation of the aboveground biomass. | ||||
| N | a | b | R2 | |
| 2004 1) | 11 | 142.19 | 2.25 | 0.99 |
| 2005 | 10 | 125.17 | 2.30 | 0.99 |
| 2006 | 12 | 114.13 | 2.39 | 0.99 |
| 2007 | 10 | 123.18 | 2.38 | 0.99 |
| 2008 | 10 | 88.494 | 2.55 | 0.98 |
| 2009 2) | 10 | 136.03 | 2.33 | 0.99 |
| 2013 3) | 7 | 82.09 | 2.60 | 0.98 |
| 1) Data from Uri et al. 2007a 2) Data from Uri et al. 2012 3) Leafless biomass R2 = coefficient of determination | ||||
| Table 3. Stand characteristics and biomass and production dynamics of naturally afforested silver birch stand growing on abandoned agricultural land. H – average height of the stand, D1.3 – average breast height diameter of the stand; N – stand density, G – basal area of the stand, CAI – current annual increment of stemwood, MAI – mean annual increment of stemwood. | |||||||||||
| Stand age | H | D1.3 | N trees | G | Leaves | Branches | Twigs | Stemwood | Stembark | CAI | MAI |
| yr | m | cm | ha–1 | m2 ha–1 | Mg ha–1 | Mg ha–1 yr–1 | |||||
| 8 | 6.6 ± 0.6 | 3.2 ± 0.1 | 11 633 | 11.3 | 3.5 | 3.0 | 0.6 | 20.4 | 3.7 | 7.4 | 3.0 |
| 9 | 7.6 ± 0.5 | 3.8 ± 0.1 | 11 533 | 13.2 | 2.9 | 3.7 | 1.0 | 24.4 | 4.4 | 4.7 | 3.2 |
| 10 | 8.5 ± 0.6 | 4.4 ± 0.1 | 10 200 | 15.2 | 2.8 | 3.9 | 0.7 | 30.8 | 5.0 | 7.0 | 3.6 |
| 11 | 9.3 ± 0.7 | 4.7 ± 0.1 | 9500 | 16.6 | 2.1 | 4.4 | 0.8 | 38.4 | 5.6 | 8.2 | 4.0 |
| 12 | 10.4 ± 0.7 | 5.4 ± 0.2 | 8300 | 18.7 | 3.7 | 5.0 | 1.5 | 44.6 | 6.8 | 7.4 | 4.3 |
| 13 1) | 10.9 ± 0.8 | 5.8 ± 0.2 | 7670 | 20.1 | 3.1 | 5.0 | 0.8 | 51.6 | 7.2 | 7.4 | 4.5 |
| 14 | 12.2 ± 0.6 | 6.4 ± 0.2 | 6567 | 21.3 | n.e. | 6.0 | 0.8 | 56.6 | 8.3 | 5.7 | 4.6 |
| 15 | 13.2 ± 0.6 | 7.9 ± 0.3 | 4233 | 20.7 | n.e. | 6.3 | 1.0 | 65.6 | 8.5 | 9.7 | 4.9 |
| 16 | 14.4 ± 0.5 | 9.1 ± 0.3 | 3133 | 20.5 | n.e. | 6.9 | 0.8 | 72.2 | 8.7 | 6.8 | 5.1 |
| 17 | 16.0 ± 0.6 | 9.9 ± 0.3 | 2733 | 20.9 | n.e. | 7.3 | 0.8 | 76.3 | 9.1 | 4.6 | 5.0 |
| n.e. - not estimated 1) - Data from Uri et al. 2012 | |||||||||||
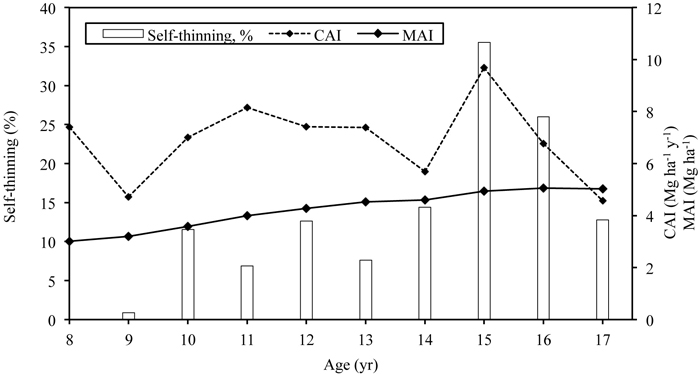
Fig. 1. The dynamics of current annual increment (CAI) and mean annual increment (MAI) in relation to self-thinning of the silver birch stand growing on abandoned agricultural land. Self-thinning is expressed as a share of number of dead trees out of previous years’ total number of trees.
| Table 4. Nitrogen budget and storages of 10-year-old silver birch stand growing on abandoned agricultural land. | ||||||
| Production, Mg ha–1 | Biomass, Mg ha–1 | N, % | N storage, kg ha-1 | N demand, kg ha–1 yr–1 | ||
| Trees | Aboveground part | |||||
| Leaves | 2.81 | 2.81 | 2.507 | 70.45 | 70.45 | |
| Stemwood | 6.45 | 30.82 | 0.178 | 54.86 | 11.48 | |
| Stembark | 0.56 | 4.99 | 0.532 | 26.55 | 2.98 | |
| Twigs | 0.72 | 0.72 | 0.827 | 5.95 | 5.95 | |
| Branches | 0.16 | 3.85 | 0.497 | 19.13 | 0.80 | |
| Aboveground total | 10.70 | 91.66 | ||||
| Belowground part | ||||||
| Stump | 0.61 | 3.59 | 0.230 | 8.25 | 1.41 | |
| Coarse roots | 0.82 | 4.77 | 0.473–0.622 | 25.99 | 4.45 | |
| Fine roots | 0.89 | 1.35 | 0.655 | 8.98 | 5.83 | |
| Belowground total | 2.32 | 11.69 | ||||
| Trees, total | 13.02 | 103.35 | ||||
| Herbs | Aboveground part | 0.12 | 0.12 | 1.746 | 2.05 | 2.05 |
| Belowground part | 1.68 | 1.68 | 0.768 | 12.90 | 12.90 | |
| 1. Total N demand for plants | 118.3 | |||||
| Leaching | 0.92 | |||||
| Gaseous losses | ||||||
| N2O-N | 0.12 | |||||
| N2-N | 83.0 | |||||
| 2. Total output fluxes | 84.04 | |||||
| Deposition | 6.4 | |||||
| Herbs starting pool | 9.8 | |||||
| Transformations | ||||||
| Net nitrogen mineralization | 156.0 | |||||
| N retranslocation in trees | 45.0 | |||||
| 3. Total input fluxes | 217.2 | |||||
| Total 3 – (1+2) | 14.8 | |||||
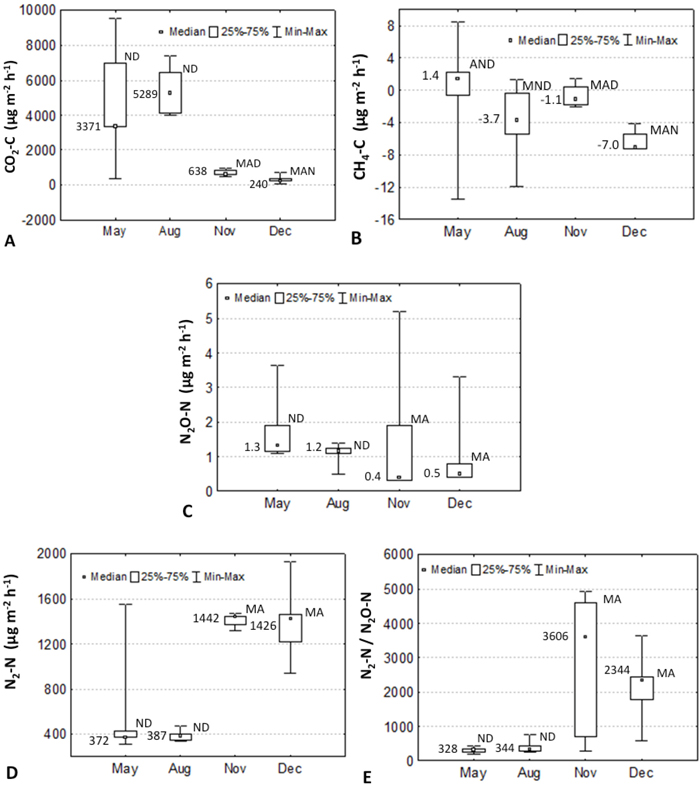
Fig. 2. Seasonal dynamics of carbon dioxide (A), methane (B), nitrous oxide (C), dinitrogen (D) emissions and N2:N2O ratio (E) in the Kambja birch stand, Estonia in 2006. Median, 25 and 75%, and min-max values are shown. Numbers show median values.
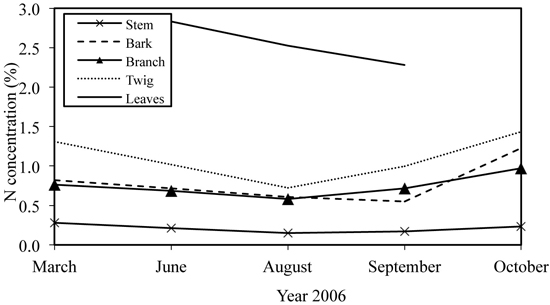
Fig. 3. Leaf abscission dynamics in young silver birch stand growing on former agricultural land.
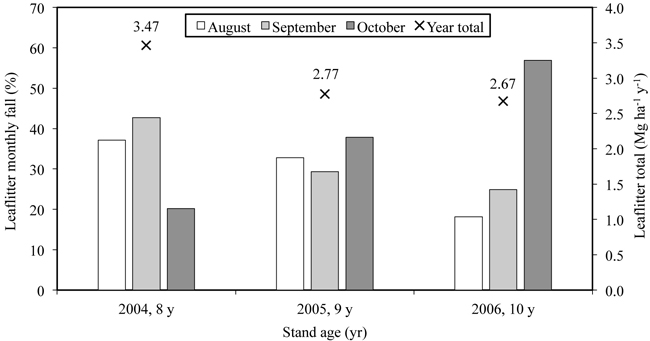
Fig. 4. The dynamics of nitrogen concentration in different fractions of the 10-year-old silver birch stand growing on former arable land.