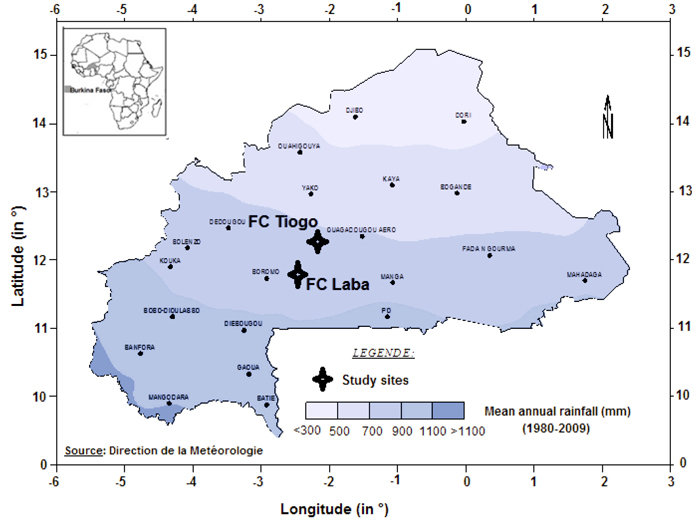
Fig. 1. Location of Laba and Tiogo forests in isohyet map of Burkina Faso.
| Table 1. Descriptive statistics (mean ± standard deviation, minimum and maximum) of the studied tree species: circumference 0.2 m above ground level (C0.2), circumference 1.30 m above ground level (C1.3) and height (H). | ||||||||||
| C0.2 (cm) | C1.3 (cm) | H (cm) | ||||||||
| N | Mean ± Sd | Min. | Max. | Mean ± Sd | Min. | Max. | Mean ±vSd | Min. | Max. | |
| Anogeissus leiocarpa | 30 | 27.5±2.7 | 8 | 61 | 18.1±1.8 | 5 | 41 | 573±50 | 247 | 1110 |
| Detarium microcarpum | 30 | 37.6±3.5 | 12 | 86 | 25.7±3.1 | 7 | 75 | 455±30 | 195 | 800 |
| Piliostigma thonningii | 30 | 26.5±1.7 | 12 | 40 | 15.7±1.4 | 6 | 30 | 334±18 | 171 | 540 |
| Vitellaria paradoxa | 10 | 29.0±9.1 | 14 | 40 | 19.5±8.5 | 8 | 34 | 426±100 | 150 | 650 |
| All species | 100 | 31.9±1.6 | 8 | 86 | 21.6±1.4 | 5 | 75 | 456±19 | 150 | 1110 |
| Table 2. The allometric equations for the below-ground biomass (BGB) (kg) of the focal species based on indicated explanatory variables: basal area at 0.2 m above ground level (BA0.2), basal area (m2) at 1.3 m above ground level (BA1.3) and height (H) (cm). SE = Standard error. Bolded rows represent parameters of best specific models. | ||||||||
| Variable | a | SEa | b | SEb | R2 | SE | p-value | |
| Anogeissus leiocarpa | BA0.2 | 150.6 | 69.4 | 0.82 | 0.08 | 0.82 | 0.40 | <0.0001 |
| BA0.2×H | 17.8 | 4.2 | 0.61 | 0.06 | 0.84 | 0.37 | <0.0001 | |
| BA1.3 | 225.4 | 125.7 | 0.77 | 0.09 | 0.78 | 0.44 | <0.0001 | |
| BA1.3×H | 25.9 | 7.9 | 0.58 | 0.06 | 0.81 | 0.41 | <0.0001 | |
| H | 0.1 | 0.03 | 1.87 | 0.24 | 0.72 | 0.49 | <0.0001 | |
| Detarium microcarpum | BA0.2 | 414.9 | 296.2 | 0.72 | 0.14 | 0.54 | 0.67 | <0.0001 |
| BA0.2×H | 75.9 | 30.7 | 0.52 | 0.10 | 0.54 | 0.68 | <0.0001 | |
| BA1.3 | 628.7 | 518.3 | 0.68 | 0.14 | 0.52 | 0.69 | <0.0001 | |
| BA1.3×H | 108.9 | 53.0 | 0.50 | 0.10 | 0.52 | 0.69 | <0.0001 | |
| Piliostigma thonningii | BA0.2 | 532.9 | 414.3 | 0.91 | 0.14 | 0.64 | 0.60 | <0.0001 |
| BA0.2×H | 94.1 | 46.7 | 0.74 | 0.11 | 0.66 | 0.58 | <0.0001 | |
| BA1.3 | 519.6 | 456.4 | 0.75 | 0.13 | 0.58 | 0.64 | <0.0001 | |
| BA1.3×H | 112.8 | 67.2 | 0.63 | 0.10 | 0.60 | 0.63 | <0.0001 | |
| Vitellaria paradoxa | BA0.2 | 38057.0 | 27231.4 | 1.72 | 0.14 | 0.95 | 0.33 | <0.0001 |
| BA0.2×H | 483.1 | 236.9 | 1.20 | 0.13 | 0.92 | 0.43 | <0.0001 | |
| BA1.3 | 5759.0 | 6001.4 | 1.15 | 0.17 | 0.85 | 0.58 | <0.0001 | |
| BA1.3×H | 385.6 | 230.8 | 0.91 | 0.12 | 0.87 | 0.53 | <0.0001 | |
| H | 0.1 | 0.2 | 2.62 | 0.81 | 0.57 | 0.99 | <0.0001 | |
| All species | BA0.2 | 912.2 | 462.3 | 1.01 | 0.09 | 0.59 | 0.82 | <0.0001 |
| BA0.2×H | 67.2 | 21.9 | 0.70 | 0.08 | 0.50 | 0.90 | <0.0001 | |
| BA1.3 | 1084.9 | 603.0 | 0.88 | 0.09 | 0.56 | 0.85 | <0.0001 | |
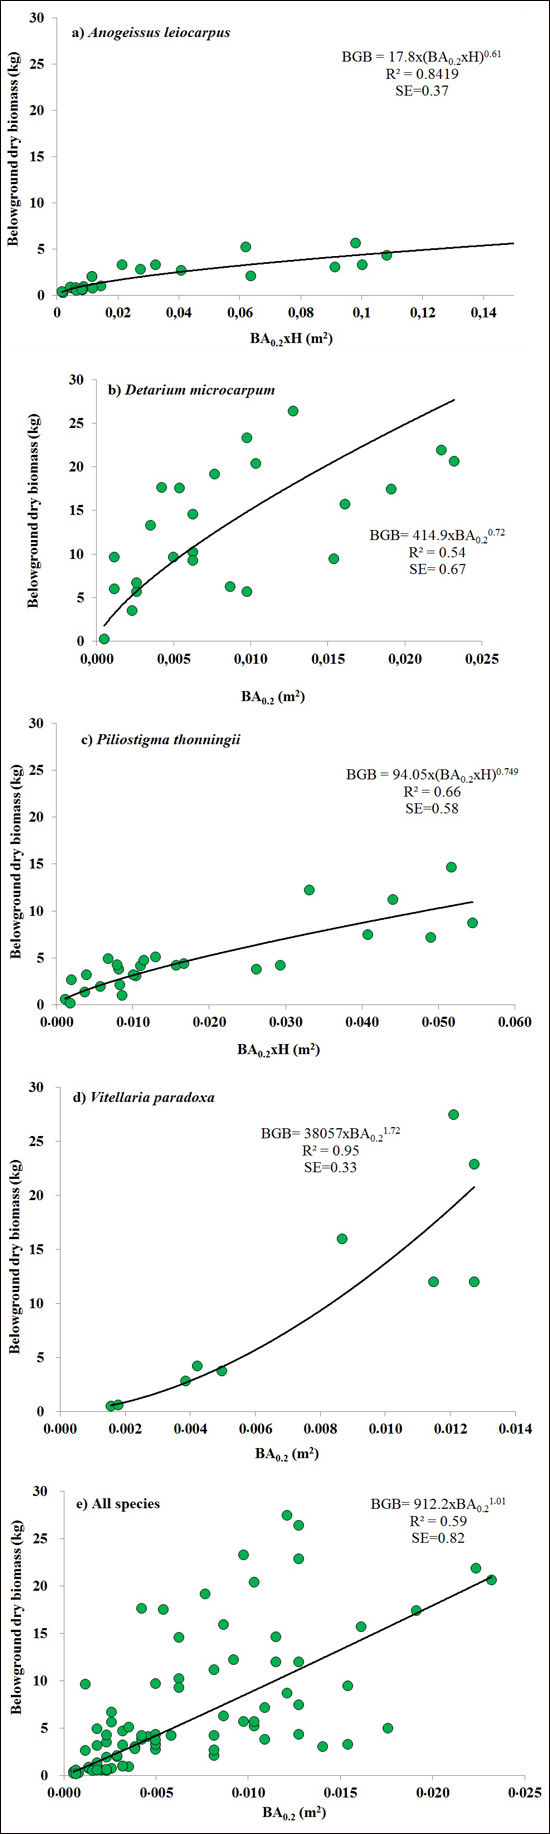
Fig. 2. The best equations for predicting belowground biomass (BGB) based on basal area at 0.2 m above ground level (BA0.2) and it combination with height (H) (BA0.2 × H) for: a) Anogeissus leiocarpa, (b) Detarium microcarpum, (c) Piliostigma thonningii, (d) Vitellaria paradoxa and (e) all species.
| Table 3. Means and 95% confidence intervals (CI 95%) of below-ground biomass (BGB), above-ground biomass (AGB) and root:shoot ratio (RS) of the sampled tree species. | ||||||
| BGB (kg) | ABG (kg) | RS | ||||
| Mean | CI 95% | Mean | CI 95% | Mean | CI 95% | |
| Anogeissus leiocarpa | 3.0 a | 6.4–12.5 | 4.4 a | 32.2–41.1 | 0.6 a | 0.1–1.0 |
| Detarium microcarpum | 26.9 c | 17.3–36.6 | 7.4 a | 29.9–44.8 | 2.9 b | 2.5–3.4 |
| Piliostigma thonningii | 5.8 ab | 3.8–15.4 | 2.2 a | 35.1–39.5 | 2.5 b | 2.0–3.0 |
| Vitellaria paradoxa | 22.7 bc | 13.3–32.2 | 97.3 b | 60.7–134.0 | 0.3 a | 0.1–0.8 |
| Mean values with the same letters in the same column are not significantly different (p < 0.05) | ||||||
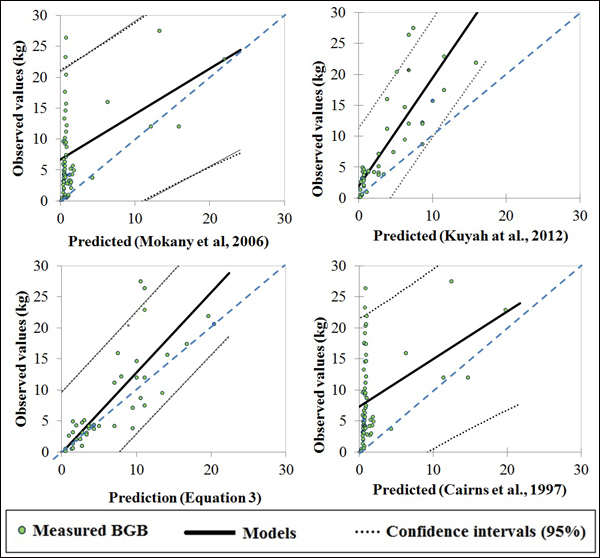
Fig. 3. Plots of measured and predicted values of published models and Eq. 3 of this study.
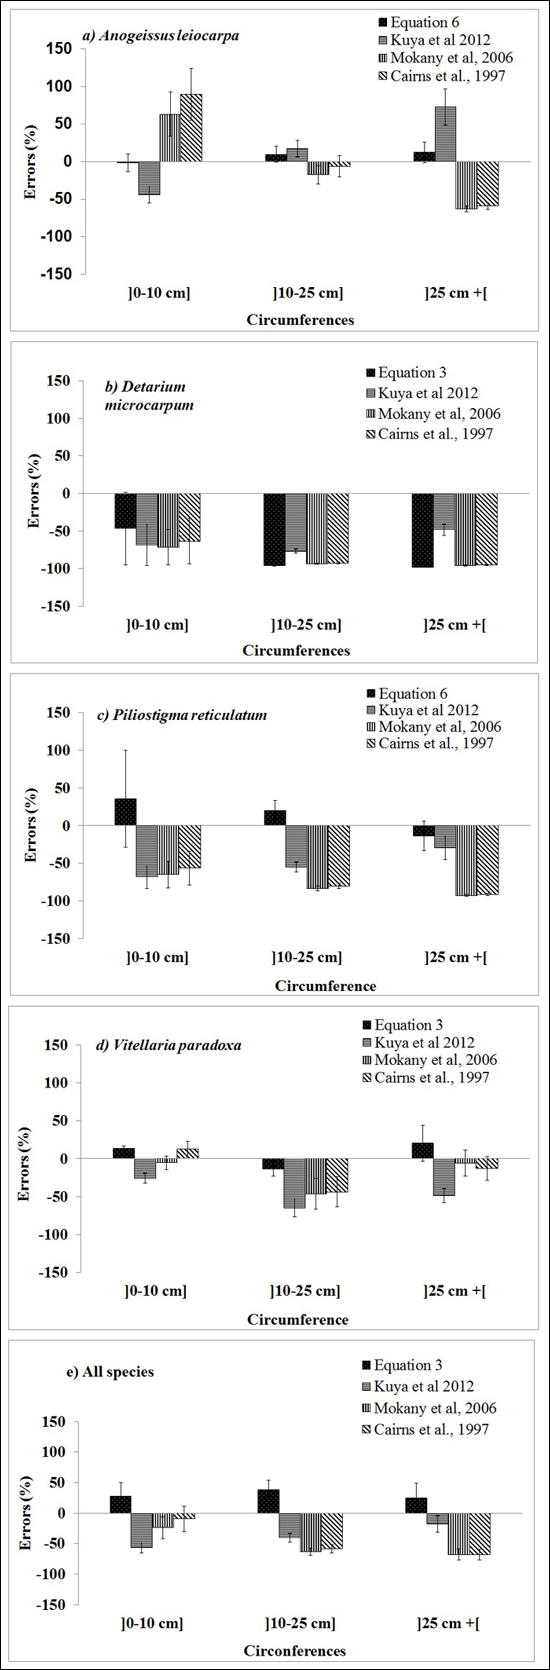
Fig. 4. Mean errors (%) for the best below-ground biomass equations for the three diameter classes of the four focal species obtained in this study (Table 3), and presented by Kuyah at al. (2012) (BGB = 0.048 × DBH2.303), Mokany et al. (2006) (BGB = 0.27 × AGB) and Cairns et al. (1997) (BGB = –1.085 + 0.9256 × ln(ABG)).