| Table 1. Quality factors and predictors to be measured in the main stages of forest regeneration. | |
| Stage | Quality factors and predictors to be measured |
| Soil preparation | Number of prepared spots ha–1 |
| Length, width and height of prepared spot (cm) | |
| Soil type (coarse – fine – peat) | |
| Stoniness (yes – no) | |
| Logging debris (yes – no) | |
| Planting | Number of planted seedlings ha–1 |
| Planting depth (cm) | |
| Seedlings distance from unprepared soil (cm) | |
| Seedling anchor (yes – no) | |
| Young stand management | Number of crop trees ha–1 |
| Composition of stand (number of pines, spruces and birches) | |
| Stand height, average (m) | |
| Stand diameter, average (cm) | |
| Number of stumps ha–1 | |
| Stump diameter, average (cm) | |
| Table 2. Number of independent-assessment sites according to service provider, stage of chain and year. | ||||
| Variable | Soil preparation | Planting | Young stand management | Total |
| Service provider | ||||
| 1 | 27 | 16 | 10 | 53 |
| 2 | 59 | 21 | 16 | 96 |
| 3 | 1 | - | 2 | 3 |
| 4 | 7 | 20 | 4 | 31 |
| 5 | - | 7 | 13 | 20 |
| 6 | - | 4 | - | 4 |
| 7 | - | - | 4 | 4 |
| Total | 94 | 68 | 49 | 211 |
| Year | ||||
| 2011 | 6 | - | 3 | 9 |
| 2012 | 35 | 24 | 33 | 92 |
| 2013 | 33 | 35 | 4 | 72 |
| 2014 | 20 | 9 | 9 | 38 |
| Total | 94 | 68 | 49 | 211 |
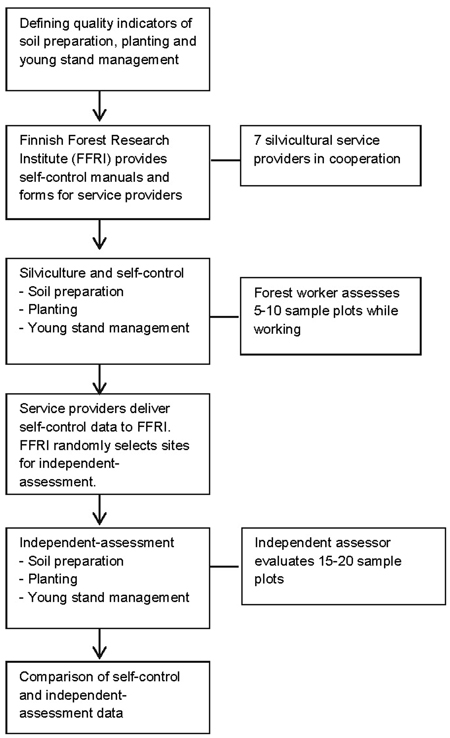
Fig. 1. Schematic of the study design and sequence.
| Table 3. Number of sample plots to be measured in self-control. | |
| Regeneration area (ha) | Number of sample plots |
| 0.50 – 1.99 | 5 |
| 2.00 – 3.99 | 6 |
| 4.00 – 5.99 | 7 |
| 6.00 – 7.99 | 8 |
| 8.00 – 9.99 | 9 |
| 10 or bigger | 10 |
| Table 4. Description of self-control (SC) and independent-assessment (IA) datasets in each stage. | ||||||
| Variable | No. of sites | Area (ha) | Sample plots | |||
| N | Min (per site) | Max (per site) | Mean (per site) | |||
| Soil preparation | ||||||
| SC | 94 | 180 | 510 | 2 | 10 | 5.4 |
| IA | 94 | 180 | 1501 | 4 | 23 | 16.4 |
| Planting | ||||||
| SC | 68 | 153 | 376 | 2 | 15 | 5.5 |
| IA | 68 | 153 | 1111 | 2 | 27 | 16.3 |
| Young stand management | ||||||
| SC | 49 | 99 | 276 | 2 | 12 | 5.7 |
| IA | 49 | 99 | 658 | 3 | 21 | 14.6 |
| Table 5. Main characteristics of soil preparation sites in independent-assessment. | |||||
| Class variable | No. of sites | % of sites | Area (ha) | No. of sample plots | % of sample plots |
| Soil type | |||||
| Coarse mineral | 48 | 51.1 | 84 | 748 | 49.8 |
| Fine mineral | 33 | 35.1 | 62 | 509 | 33.9 |
| Peat | 7 | 7.4 | 15 | 183 | 12.2 |
| No dominant | 6 | 6.4 | 19 | - | - |
| Unknown | 61 | 4.1 | |||
| Stony soil | 10 | 10.6 | 16 | 98 | 6.6 |
| Disruptive logging debris | 3 | 3.2 | 4 | 72 | 4.9 |
| Soil preparation | |||||
| Spot mounding | 87 | 92.6 | 160 | 1295 | 86.3 |
| Ditch mounding | 6 | 6.3 | 17 | 188 | 12.5 |
| Patching | - | - | - | 12 | 0.8 |
| No dominant | 1 | 1.1 | 3 | 6 | 0.4 |
| Site type (*) | |||||
| OMaT | - | - | - | - | - |
| OMT | 16 | 17 | 22 | 255 | 17 |
| MT | 52 | 55.3 | 102 | 859 | 57.2 |
| VT | 8 | 8.5 | 20 | 118 | 7.9 |
| CT | - | - | - | - | - |
| CIT | - | - | - | - | - |
| No dominant | 3 | 3.2 | 5 | - | - |
| Unknown | 15 | 16 | 31 | 269 | 17.9 |
| Target density | |||||
| 1600 | 1 | 1.1 | 1.4 | 20 | 1.3 |
| 1800 | 16 | 17 | 32.7 | 269 | 17.9 |
| 1900 | 8 | 8.5 | 19.2 | 122 | 8.1 |
| 2000 | 36 | 38.3 | 53.3 | 537 | 35.8 |
| Unknown | 33 | 35.1 | 73.2 | 553 | 36.8 |
| Soil preparation equipment | |||||
| Mounding plate | 50 | 53.2 | 88 | 766 | 54 |
| Digger shovel | 31 | 33 | 70 | 514 | 34.3 |
| Both | 8 | 8.5 | 11 | 132 | 8.8 |
| Unknown | 5 | 5.3 | 11 | 89 | 5.9 |
| Work period | |||||
| Spring | 53 | 56.4 | 103 | 838 | 55.8 |
| Autumn | 40 | 42.5 | 76 | 643 | 42.8 |
| Unknown | 1 | 1.1 | 1 | 20 | 1.3 |
| (*) Site type according to Cajander (1949). | |||||
| Table 6. Main characteristics of modelling data set for soil preparation. | ||||||
| Variable | N | Mean | SD | Min | Max | |
| Self-control 2011–2014 | ||||||
| No. of spot mounds | 510 | 8.40 | 3.67 | 0 | 20 | |
| No. of ditch mounds | 510 | 1.21 | 3.23 | 0 | 17 | |
| No. of inverted mounds | 510 | 0.05 | 0.67 | 0 | 11 | |
| No. of patches | 510 | 0.24 | 1.21 | 0 | 11 | |
| No. of preparation spots | 510 | 9.90 | 1.73 | 6 | 20 | |
| Height of mound, cm | 446 | 16.82 | 5.32 | 9 | 35 | |
| Footprint preparation spot, m2 | 468 | 0.37 | 0.13 | 0.05 | 0.9 | |
| Independent-assessment 2012–2014 | ||||||
| No. of spot mounds | 1501 | 7.9 | 3.59 | 0 | 18 | |
| No. of ditch mounds | 1501 | 1.1 | 2.83 | 0 | 16 | |
| No. of inverted mounds | 1501 | 0.0 | 0.00 | 0 | 0 | |
| No. of patches | 1501 | 0.1 | 0.67 | 0 | 11 | |
| No. of preparation spots | 1501 | 9.1 | 2.18 | 1 | 18 | |
| Height of mound, cm | 1478 | 16.7 | 6.30 | 5 | 60 | |
| Footprint of preparation spot, m2 | 1501 | 0.5 | 0.29 | 0.07 | 2.56 | |
| N = number of sample plots. Note: variation among N occurs due to the removal of incomplete or illogical measurements. | ||||||
| Table 7. Main characteristics of planting sites in independent-assessment. | |||||
| Class variable | No. of sites | % of sites | Area (ha) | No. of sample plots | % of sample plots |
| Seedling | |||||
| Pine | 8 | 11.8 | 13.6 | 162 | 14.6 |
| Spruce | 52 | 76.5 | 120.1 | 949 | 85.4 |
| Pine + spruce | 8 | 11.8 | 19.2 | ||
| Soil preparation | |||||
| Mounding | 63 | 92.6 | 136.5 | 1023 | 92 |
| Disc trenching | 2 | 2.9 | 1.6 | 28 | 2.5 |
| Stump removal | 3 | 4.4 | 14.8 | 60 | 5.5 |
| Target density | |||||
| 1800 | 17 | 25 | 44.4 | 300 | 27 |
| 1900 | 1 | 1.5 | 1.1 | 15 | 1.4 |
| 2000 | 37 | 54.4 | 71.9 | 560 | 50.4 |
| Unknown | 13 | 19.1 | 35.5 | 236 | 21.2 |
| Site type (*) | |||||
| OMaT | - | - | - | - | - |
| OMT | 11 | 16.2 | 27.2 | 192 | 17.3 |
| MT | 28 | 41.2 | 55.2 | 483 | 43.5 |
| VT | 13 | 19.1 | 26.3 | 210 | 18.9 |
| CT | - | - | - | - | - |
| CIT | - | - | - | - | - |
| Unknown | 16 | 23.5 | 44.2 | 226 | 20.3 |
| (*) Site type according to Cajander (1949). | |||||
| Table 8. Main characteristics of modelling data set for planting. | |||||
| Variable | N | Mean | SD | Min | Max |
| Self-control 2011–2014 | |||||
| No. of seedlings planted to prepared spot | 376 | 9.51 | 2.19 | 0 | 15 |
| No. of seedlings planted to unprepared soil | 376 | 0.49 | 1.25 | 0 | 9 |
| No. of seedlings planted overall | 376 | 10.00 | 1.58 | 4 | 15 |
| Planting depth, cm | 371 | 4.58 | 1.41 | 1 | 10 |
| Distance from humus edge, cm | 289 | 32.78 | 16.86 | 0 | 130 |
| Independent-assessment 2012–2014 | |||||
| No. of seedlings planted to prepared spot | 1111 | 8.09 | 2.61 | 0 | 18 |
| No. of seedlings planted to unprepared soil | 1111 | 0.95 | 1.87 | 0 | 13 |
| No. of seedlings planted overall | 1111 | 9.03 | 2.37 | 0 | 22 |
| Planting depth, cm | 1111 | 6.21 | 2.38 | 0 | 10 |
| Distance from humus edge, cm | 1073 | 23.45 | 13.28 | 0 | 70 |
| N = number of sample plots. Note: variation among N occurs due to the removal of incomplete or illogical measurements. | |||||
| Table 9. Main characteristics of young stand management sites in independent-assessment. | |||||
| Class variable | No. of stands | % of stands | Area (ha) | No. of sample plots | % of sample plots |
| Site type (*) | |||||
| OMaT | - | - | - | - | - |
| OMT | 6 | 12.2 | 13.5 | 82 | 12.5 |
| MT | 11 | 22.4 | 21.5 | 175 | 26.6 |
| VT | 6 | 12.2 | 11.5 | 102 | 15.5 |
| CT | - | - | - | 11 | 1.7 |
| CIT | - | - | - | - | - |
| No dominant | 1 | 2 | 1.2 | - | - |
| Unknown | 25 | 51 | 51.1 | 288 | 43.8 |
| Dominant tree | |||||
| Pine | 19 | 38.8 | 45.3 | 276 | 41.9 |
| Spruce | 14 | 28.6 | 30.7 | 189 | 28.7 |
| Birch | 8 | 16.3 | 10 | 143 | 21.7 |
| No dominant | 8 | 16.3 | 12.8 | 50 | 7.6 |
| Method | |||||
| Early clearing | 7 | 14.3 | 17.8 | 85 | 12.9 |
| Normal tending | 35 | 71.4 | 72.9 | 428 | 65 |
| Later tending | 7 | 14.3 | 8.1 | 145 | 22 |
| (*) Site type according to Cajander (1949). | |||||
| Table 10. Main characteristics of modelling data set for young stand management. | |||||
| Variable | N | Mean | SD | Min | Max |
| Self-control 2011–2014 | |||||
| No. of spruces | 276 | 3.29 | 3.63 | 0 | 11 |
| No. of pines | 276 | 4.57 | 5.14 | 0 | 16 |
| No. of birches | 276 | 2.49 | 2.91 | 0 | 11 |
| No. of other broadleaf trees | 276 | 0.00 | 0.00 | 0 | 0 |
| No. of trees overall | 276 | 10.34 | 2.21 | 3 | 16 |
| Dominant height of trees, m | 276 | 4.43 | 1.73 | 2 | 10 |
| Diameter of trees, cm | 276 | 5.04 | 2.23 | 2 | 13 |
| No. of stumps | 276 | 24.18 | 13.21 | 0 | 69 |
| Diameter of stumps, cm | 225 | 3.08 | 1.06 | 1 | 6 |
| Independent-assessment 2012–2014 | |||||
| No. of spruces | 658 | 3.27 | 3.78 | 0 | 16 |
| No. of pines | 658 | 4.67 | 4.94 | 0 | 20 |
| No. of birches | 658 | 2.78 | 3.29 | 0 | 18 |
| No. of other broadleaf trees | 658 | 0.02 | 0.16 | 0 | 2 |
| No. of trees overall | 658 | 10.74 | 3.21 | 2 | 25 |
| Dominant height of trees, m | 658 | 5.00 | 2.27 | 2 | 15 |
| Diameter of trees, cm | 658 | 5.10 | 2.44 | 1 | 13 |
| No. of stumps | 649 | 15.07 | 12.26 | 0 | 100 |
| Diameter of stumps, cm | 635 | 2.48 | 1.11 | 0.5 | 8.5 |
| N = number of sample plots. Note: variation among N occurs due to the removal of incomplete or illogical measurement. | |||||
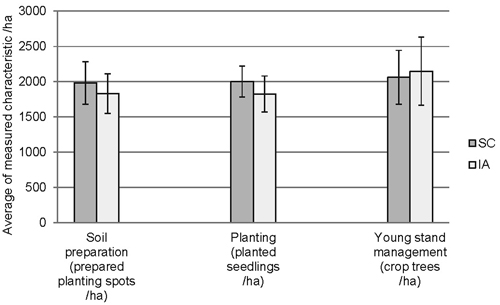
Fig. 2. Means and standard deviations of the assessed variables in different stages of the regeneration process (SC = Self-control, IA = Independent assessment).
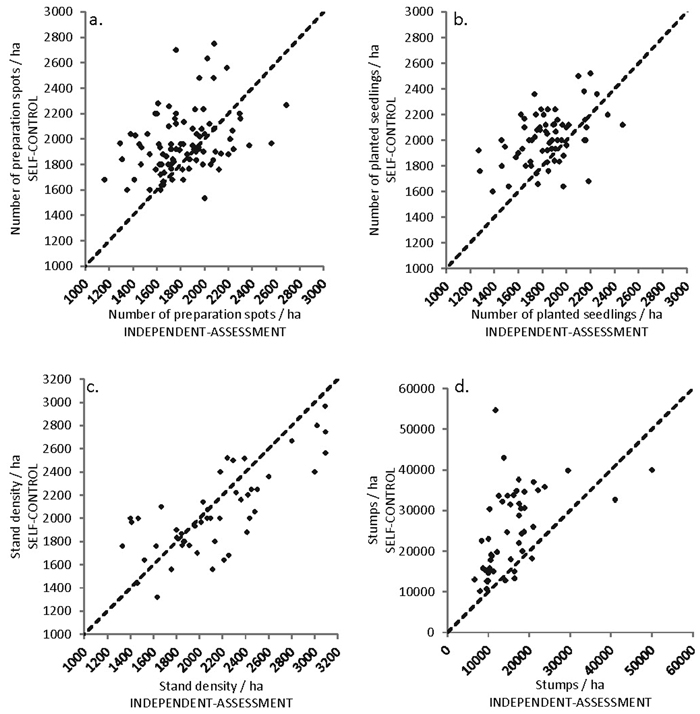
Fig. 3. Comparison of self-control and independent-assessment results. Each point of the scatter plot displays individual working site.
| Table 11. Multivariate multilevel model for soil preparation. Parameter estimates and variance components of equations for number, height and footprint of prepared spots. The most common values of the class variables were used as a reference class. | |||||||||||
| Predictor | No. of prepared spots | Height of mound (cm) | Footprint of prepared spot (m2) | ||||||||
| Estimate | SE | χ2-value | Estimate | SE | χ2-value | Estimate | SE | χ2-value | |||
| Intercept | 9.76 | 0.29 | 1103.3 *** | 16.16 | 0.50 | 1053.8 *** | 0.56 | 0.04 | 235.9 *** | ||
| Discrepancy | 0.55 | 0.34 | 2.6 ns | –0.68 | 1.03 | 0.4 ns | –0.18 | 0.04 | 19.1 *** | ||
| Soil texture | |||||||||||
| Fine mineral | |||||||||||
| IA | 0.13 | 0.14 | 0.9 ns | 0.60 | 0.45 | 1.8 ns | 0.00 | 0.02 | 0.1 ns | ||
| SC | 0.00 | 0.24 | 1.55 | 0.77 | 4.0 ** | 0.01 | 0.02 | 0.3 ns | |||
| Peat | |||||||||||
| IA | –0.59 | 0.18 | 11.1 *** | 1.92 | 0.58 | 10.9 *** | –0.02 | 0.02 | 0.8 ns | ||
| SC | 0.46 | 0.28 | 2.7 * | 2.57 | 0.90 | 8.3 ** | 0.07 | 0.03 | 6.9 ** | ||
| Stony soil | |||||||||||
| IA | –1.92 | 0.21 | 86.9 *** | –0.97 | 0.70 | 1.9 ns | –0.06 | 0.03 | 5.2 * | ||
| SC | 1.04 | 0.27 | 14.3 *** | –0.12 | 0.90 | 0.0 ns | 0.02 | 0.03 | 0.7 ns | ||
| Logging debris | |||||||||||
| IA | –1.82 | 0.21 | 72.9 *** | –2.08 | 0.74 | 7.9 ** | –0.04 | 0.03 | 2.7 ns | ||
| SC | 1.16 | 0.28 | 16.9 *** | 0.81 | 0.97 | 0.7 ns | 0.02 | 0.03 | 0.4 ns | ||
| Random part | |||||||||||
| SD (uk) | |||||||||||
| IA | 1.05 | 0.4721 | - | 1.41 | 1.1733 | - | 0.12 | 0.0071 | - | ||
| SC | 0.81 | 0.3097 | - | 3.26 | 4.667 | - | 0.08 | 0.0027 | - | ||
| SD (ukj) | |||||||||||
| IA | 0.78 | 0.1276 | - | 2.01 | 0.9953 | - | 0.15 | 0.0041 | - | ||
| SC | 0.68 | 0.1149 | - | 2.11 | 1.138 | - | 0.04 | 0.0005 | - | ||
| SD (ekji) | |||||||||||
| IA | 1.65 | 0.1032 | - | 5.79 | 1.2801 | - | 0.20 | 0.0016 | - | ||
| SC | 1.06 | 0.0826 | - | 3.12 | 0.765 | - | 0.08 | 0.0005 | - | ||
| Discrepancy = difference between self-control (SC) and independent-assessment (IA), SE = Standard error, SD = Standard deviation. * significant at 0.05, ** significant at 0.01 and *** significant at 0.001 level. “ns” = non-significant at 0.1 level. Subscripts i, j and k refer to sample plot, regeneration area and combined contractor and year. | |||||||||||
| Table 12. Multivariate multilevel model for soil preparation. Variance explained at different hierarchical levels for number, height and footprint of prepared spots. Fixed effects are the same as in Table 11. | ||||||||||
| Variable and hierarchy level | Variance | Proportion % | Error variance of self-control | Correlation r | Error proportion % | |||||
| Without fixed effects | With fixed effects | Difference % | Without fixed effects | With fixed effects | Without fixed effects | With fixed effects | Difference % | |||
| No. of prepared spots | ||||||||||
| Contractor | 1.104 | 1.100 | 0.4 | 22.2 | 24.8 | 1.51 | 1.15 | 23.8 | –0.71 | 105 |
| Regeneration area | 0.886 | 0.615 | 30.6 | 17.8 | 13.9 | 1.03 | 0.71 | 31.3 | –0.65 | 115 |
| Sample plot | 2.992 | 2.720 | 9.1 | 60.1 | 61.3 | - | - | - | - | - |
| Mound height (cm) | ||||||||||
| Contractor | 1.754 | 1.982 | –13.0 | 4.4 | 5.0 | 17.19 | 10.38 | 39.6 | –0.19 | 523 |
| Regeneration area | 4.047 | 4.058 | –0.3 | 10.1 | 10.3 | 5.46 | 4.21 | 23.0 | –0.46 | 104 |
| Sample plot | 34.106 | 33.468 | 1.9 | 85.5 | 84.7 | - | - | - | - | - |
| Footprint of prepared spot (m2) | ||||||||||
| Contractor | 0.022 | 0.014 | 38.4 | 25.1 | 17.6 | 0.03 | 0.02 | 37.2 | –0.80 | 121 |
| Regeneration area | 0.024 | 0.023 | 2.5 | 26.5 | 29.5 | 0.03 | 0.03 | –3.6 | –0.96 | 112 |
| Sample plot | 0.043 | 0.042 | 3.9 | 48.4 | 52.9 | - | - | - | - | - |
| Table 13. Multivariate multilevel model for planting. Parameter estimates and variance components of the equations for the number of planted seedlings, planting depth, and distance from humus edge. The most common values of the class variables were used as a reference class. | |||||||||||
| Predictor | Planted seedlings | Planting depth (cm) | Distance from humus (cm) | ||||||||
| Estimate | SE | χ2-value | Estimate | SE | χ2-value | Estimate | SE | χ2-value | |||
| Intercept | 8.88 | 0.23 | 1520.8 *** | 6.32 | 0.31 | 416.6 *** | 23.11 | 1.60 | 209.3 *** | ||
| Discrepancy | 0.79 | 0.21 | 14.01 *** | –1.63 | 0.32 | 26.2 *** | 8.94 | 3.16 | 8.0 ** | ||
| Seedling species | |||||||||||
| Pine | |||||||||||
| IA | 0.40 | 0.31 | 1.65 ns | 0.19 | 0.30 | 0.4 ns | –1.65 | 1.84 | 0.8 ns | ||
| SC | 0.08 | 0.33 | 0.06 ns | –1.48 | 0.36 | 16.9 *** | 4.23 | 3.76 | 1.3 ns | ||
| Mixed | |||||||||||
| IA | 1.07 | 0.58 | 3.38 ns | –0.28 | 0.65 | 0.2 ns | 0.00 | 0.00 | 0.0 | ||
| SC | 0.00 | 0.00 | 0.00 | 0.00 | 0.00 | 0.0 | 0.00 | 0.00 | 0.0 | ||
| Random part | |||||||||||
| SD (uk) | |||||||||||
| IA | 0.83 | 0.3385 | - | 1.30 | 0.6402 | - | 6.21 | 16.5823 | - | ||
| SC | 0.95 | 0.33 | - | 0.80 | 0.2557 | - | 11.64 | 54.0982 | - | ||
| SD (ukj) | |||||||||||
| IA | 0.91 | 0.2303 | - | 0.91 | 0.2185 | - | 5.59 | 8.2111 | - | ||
| SC | 0.39 | 0.0954 | - | 0.49 | 0.0904 | - | 4.29 | 10.7414 | - | ||
| SD (ekji) | |||||||||||
| IA | 2.07 | 0.1884 | - | 1.83 | 0.1472 | - | 10.81 | 5.2042 | - | ||
| SC | 1.25 | 0.1273 | - | 0.95 | 0.0747 | - | 11.69 | 12.7362 | - | ||
| Discrepancy = difference between self-control (SC) and independent-assessment (IA). SE = Standard error, SD = Standard deviation. * significant at 0.05, ** significant at 0.01 and *** significant at 0.001 level. “ns” = non-significant at 0.1 level. Subscripts i, j and k refer to sample plot, regeneration area and worker. | |||||||||||
| Table 14. Multivariate multilevel model for planting. Variances explained at different hierarchical levels for the number of planted seedlings, planting depth, and distance from humus edge. Fixed effects are the same as in Table 13. | ||||||||||
| Variable and hierarchy level | Variance | Proportion % | Error variance of self-control | Correlation r | Error proportion % | |||||
| Without fixed effects | With fixed effects | Difference % | Without fixed effects | With fixed effects | Without fixed effects | With fixed effects | Difference % | |||
| No. of planted seedlings | ||||||||||
| Worker + year | 0.835 | 0.690 | 17.4 | 14.1 | 11.8 | 0.42 | 0.52 | –24 | –0.26 | 75 |
| Regeneration area | 0.804 | 0.835 | –3.9 | 13.5 | 14.3 | 0.34 | 0.32 | 6 | –0.97 | 39 |
| Sample plot | 4.301 | 4.304 | –0.1 | 72.4 | 73.8 | - | - | - | - | - |
| Planting depth (cm) | ||||||||||
| Worker + year | 1.698 | 1.699 | 1.0 | 28.8 | 28.9 | 1.63 | 1.65 | –1 | –0.81 | 97 |
| Regeneration area | 0.834 | 0.821 | 1.9 | 14.2 | 14.0 | 0.92 | 0.69 | 25 | –0.84 | 84 |
| Sample plot | 3.358 | 3.361 | –0.2 | 57.0 | 57.1 | - | - | - | - | - |
| Distance from humus edge (cm) | ||||||||||
| Worker + year | 38.892 | 38.522 | –0.1 | 20.8 | 20.6 | 121.74 | 133.48 | –10 | –0.25 | 347 |
| Regeneration area | 31.891 | 31.270 | 1.6 | 17.0 | 16.8 | 69.02 | 62.65 | 9 | –0.85 | 200 |
| Sample plot | 116.575 | 116.808 | –0.1 | 62.2 | 62.6 | - | - | - | - | - |
| Table 15. Multivariate multilevel model for young stand management (crop trees). Parameters, estimates and variance components of the equations for the number of coniferous trees, number of birches, height of trees, and diameter of trees. The most common values of the class variables were used as a reference class. | ||||||||||||
| Predictor | Number of coniferous trees | Number of birches | Average height of trees | Average diameter of trees | ||||||||
| Estimate | SE | χ2-value | Estimate | SE | χ2-value | Estimate | SE | χ2-value | Estimate | SE | χ2-value | |
| Intercept | 7.66 | 0.49 | 245.0 *** | 3.00 | 0.35 | 71.5 *** | 4.97 | 0.27 | 334.2 *** | 5.05 | 0.27 | 338.1 *** |
| Discrepancy | –0.24 | 0.23 | 1.1 ns | –0.22 | 0.16 | 1.9 ns | –0.57 | 0.14 | 16.7 *** | –0.09 | 0.15 | 0.4 ns |
| Random part | ||||||||||||
| SD (uj) | ||||||||||||
| IA | 3.33 | 2.3722 | - | 2.38 | 1.2422 | - | 1.87 | 0.7329 | - | 1.87 | 0.7455 | - |
| SC | 3.19 | 2.2295 | - | 2.23 | 1.1465 | - | 1.39 | 0.4267 | - | 1.68 | 0.6365 | - |
| SD (uji) | ||||||||||||
| IA | 2.35 | 0.3152 | - | 2.35 | 0.3152 | - | 1.18 | 0.0802 | - | 1.42 | 0.1158 | - |
| SC | 2.13 | 0.423 | - | 1.94 | 0.3515 | - | 0.99 | 0.0913 | - | 1.27 | 0.1512 | - |
| Discrepancy = difference between self-control (SC) and independent-assessment (IA). SE = Standard error, SD = Standard deviation. * significant at 0.05, ** significant at 0.01 and *** significant at 0.001 level. “ns” = non-significant at 0.1 level. Subscripts i and j refer to sample plot and stand. | ||||||||||||
| Table 16. Multivariate multilevel model for young stand management (crop trees). Variances explained at different hierarchical levels for number of coniferous trees, number of birches, height of trees, and diameter of trees. The fixed effects are the same as in Table 15. | ||||||||||
| Variable and hierarchy level | Variance | Proportion % | Error variance of self-control | Correlation r | Error proportion % | |||||
| Without fixed effects | With fixed effects | Difference % | Without fixed effects | With fixed effects | Without fixed effects | With fixed effects | Difference % | |||
| Number of coniferus trees | ||||||||||
| Stand | 11.115 | - | - | 66.9 | - | 1.04 | - | - | –0.30 | 9 |
| Sample plot | 5.507 | - | - | 33.1 | - | - | - | - | - | - |
| Number of birches | ||||||||||
| Stand | 5.676 | - | - | 50.8 | - | 0.20 | - | - | –0.43 | 3 |
| Sample plot | 5.507 | - | - | 49.2 | - | - | - | - | - | - |
| Height of stand (m) | ||||||||||
| Stand | 3.513 | - | - | 63.5 | - | 0.69 | - | - | –0.44 | 20 |
| Sample plot | 2.023 | - | - | 36.5 | - | - | - | - | - | - |
| Average diameter of stand (cm) | ||||||||||
| Stand | 3.500 | - | - | 71.4 | - | 0.63 | - | - | –0.74 | 18 |
| Sample plot | 1.400 | - | - | 28.6 | - | - | - | - | - | - |
| Table 17. Multivariate multilevel model for young stand management (removed trees). Parameter estimates and variance components of the equations for number of stumps and average diameter of stumps. The most common values of the class variables were used as a reference class. | |||||||
| Predictor | Number of stumps | Average diameter of stumps (cm) | |||||
| Estimate | SE | χ2 -value | Estimate | SE | χ2 -value | ||
| Intercept | 13.73 | 1.30 | 112.3 *** | 2.4045 | 0.11 | 477.8 *** | |
| Discrepancy | 7.606 | 1.78 | 18.4 *** | 0.5604 | 0.15 | 14.9 *** | |
| Dominant tree | |||||||
| Spruce | |||||||
| IA | 3.41 | 1.57 | 4.7 * | 0.00 | 0.13 | 0.0 ns | |
| SC | 1.86 | 2.38 | 0.6 ns | 0.18 | 0.18 | 1.0 ns | |
| Birch | |||||||
| IA | 3.81 | 1.48 | 6.6 * | 0.17 | 0.13 | 1.9 ns | |
| SC | 3.59 | 2.40 | 2.2 ns | –0.12 | 0.19 | 0.4 ns | |
| Mixed | |||||||
| IA | 3.61 | 1.88 | 3.7 * | 0.25 | 0.16 | 2.3 ns | |
| SC | 5.12 | 4.16 | 1.5 ns | –0.37 | 0.36 | 1.1 ns | |
| Random part | |||||||
| SD (uj) | |||||||
| IA | 6.62 | 10.885 | - | 0.57 | 0.0811 | - | |
| SC | 9.08 | 20.0964 | - | 0.71 | 0.1347 | - | |
| SD (uji) | |||||||
| IA | 10.56 | 6.4266 | - | 0.94 | 0.0517 | - | |
| SC | 9.18 | 7.8922 | - | 0.75 | 0.0589 | - | |
| Discrepancy = difference between self-control (SC) and independent-assessment (IA). SE = Standard error, SD = Standard deviation. * significant at 0.05, ** significant at 0.01 and *** significant at 0.001 level. “ns” = non-significant at 0.1 level. Subscripts i and j refer to sample plot and stand. | |||||||
| Table 18. Multivariate multilevel model for young stand management (removed trees). Variances explained at different hierarchical levels for number of stumps and average diameter of stumps. The fixed effects are the same as in Table 17. | ||||||||||
| Variable and hierarchy level | Variance | Proportion % | Error variance of self-control | Correlation r | Error proportion % | |||||
| Without fixed effects | With fixed effects | Difference % | Without fixed effects | With fixed effects | Without fixed effects | With fixed effects | Difference % | |||
| No. of stumps | ||||||||||
| Stand | 44.68 | 43.76 | 2.1 | 28.5 | 28.2 | 55.55 | 56.27 | –1 | –0.18 | 129 |
| Sample plot | 112.13 | 111.48 | 0.6 | 71.5 | 71.8 | - | - | - | - | - |
| Average stump diameter (cm) | ||||||||||
| Stand | 0.33 | 0.32 | 2.9 | 27.3 | 26.7 | 0.22 | 0.24 | –9 | –0.10 | 76 |
| Sample plot | 0.89 | 0.89 | –0.1 | 72.7 | 73.3 | - | - | - | - | - |