| Table 1. Genetic diversity of seed orchard parents and offspring. | ||||||||
| Marker | Parents | Offspring | ||||||
| Locus | PIC | F(null) | A | Ho | He | A | Ho | He |
| 2G12 | 0.855 | 0.154 | 15.00 | 0.438 | 0.858 | 19.00 | 0.665 | 0.867 |
| 3B9 | 0.860 | 0.165 | 19.00 | 0.636 | 0.900 | 27.00 | 0.624 | 0.863 |
| 3F1 | 0.912 | 0.225 | 21.00 | 0.630 | 0.928 | 25.00 | 0.574 | 0.917 |
| 4G2 | 0.855 | 0.096 | 10.00 | 0.776 | 0.863 | 14.00 | 0.706 | 0.870 |
| 3D5 | 0.862 | 0.288 | 18.00 | 0.419 | 0.887 | 16.00 | 0.500 | 0.873 |
| 2D4 | 0.937 | 0.180 | 26.00 | 0.510 | 0.953 | 30.00 | 0.681 | 0.938 |
| 3G9 | 0.840 | 0.419 | 17.00 | 0.436 | 0.861 | 26.00 | 0.342 | 0.851 |
| 2C2 | 0.738 | 0.326 | 15.00 | 0.647 | 0.877 | 20.00 | 0.358 | 0.745 |
| Mean | 0.857 | 0.232 | 17.63 | 0.562 | 0.891 | 22.13 | 0.556 | 0.866 |
| SE | 0.019 | 0.035 | 1.56 | 0.043 | 0.011 | 1.88 | 0.047 | 0.019 |
| PIC – polymorphic information content F(null) – null allele frequency estimator A – allelic richness Ho – observed heterozygosity He – expected heterozygosity | ||||||||
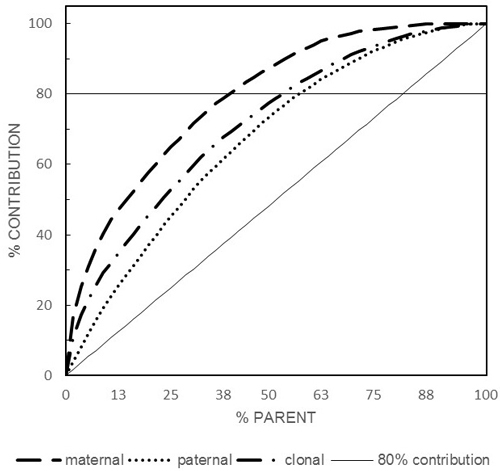
Fig. 1. Paternal, maternal and clonal cumulative reproductive success (80% contribution is represented by the horizontal line).
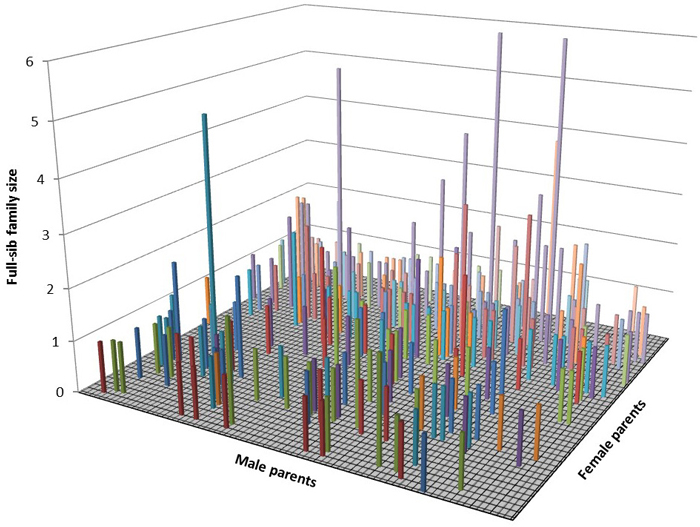
Fig. 2. Three dimensional representation of the mating dynamics in the seed orchard.