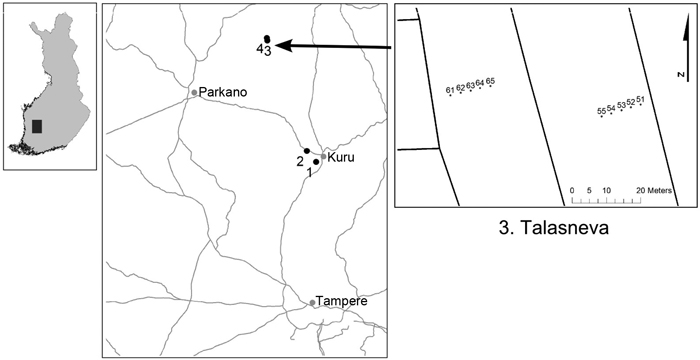
Fig. 1. Location of the studied drained peatland forests and an example of the principle for the set-up of the study transects and sample plots within transects in Talasneva.
| Table 1. Site and stand characteristics of the data (averages of each studied peatland). | ||||
| Peatland | ||||
| Characteristic | 1 | 2 | 3 | 4 |
| Site type*) | MtkgII | VatkgII | PtkgII | PtkgII |
| Latitude | 61°51.5′ | 61°53.1′ | 62°08.9′ | 62°09.3′ |
| Longitude | 23°41.9′ | 23°38.9′ | 23°24.7′ | 23°24.5′ |
| Peat thickness, m | 4.8 | 4.1 | 1.3 | 1.2 |
| Stand volume, m3 ha–1 | 258.6 | 72.3 | 168.0 | 324.8 |
| Stand basal area, m2 ha–1 | 28.5 | 12.8 | 21.8 | 38.2 |
| *) following the site type classification of Laine et al. (2012). | ||||
| Table 2. Minimum, mean and maximum values (mm) of the weather variables (ET = evapotranspiration, P = precipitation) in the data (years 2014 and 2015 pooled). | |||
| Variable | min. | mean | max. |
| ET1d *) | 0.4 | 3.1 | 5.5 |
| ET3d | 2.2 | 10.3 | 18.3 |
| ET5d | 6.3 | 18.3 | 31.1 |
| ET10d | 10.4 | 35.6 | 51.5 |
| ET2w | 13.6 | 54.5 | 73.9 |
| ET3w | 23.2 | 82.6 | 115.8 |
| ET4w | 36.3 | 106.8 | 135.0 |
| P1d | 0.0 | 3.2 | 27.4 |
| P3d | 0.0 | 5.4 | 27.4 |
| P5d | 0.0 | 8.7 | 48.8 |
| P10d | 0.0 | 19.5 | 53.5 |
| P2w | 0.0 | 24.6 | 59.4 |
| P3w | 3.5 | 27.1 | 73.3 |
| P4w | 5.5 | 45.7 | 83.2 |
| *) 1d = one day, 2d = two days, …, 2w = two weeks, etc. | |||
| Table 3. A null model (intercept only) and the final model for drained peatland WTD during the growing season. | ||||
| Null model | Final model | |||
| Parameter | Estimate | std error | Estimate | std error |
| Fixed part | ||||
| Intercept | 27.926 | 5.597 | 37.353 | 4.879 |
| DDist | –0.790 | 0.079 | ||
| Vol*DOY*10–4 | 0.635 | 0.203 | ||
| ET4w*DOY*10–3 | 0.610 | 0.061 | ||
| P4w | –0.256 | 0.015 | ||
| Random part | Variance | Variance | ||
| Site | 87.31 | 46.514 | ||
| Transect | 13.33 | 17.428 | ||
| Sample plot | 48.24 | 1.907 | ||
| Sample plot:year | 23.77 | 37.043 | ||
| Random error | 120.12 | 48.825 | ||
| DDist = distance to nearest ditch, m Vol = Volume of the sample plot with 3 m radius, m3 ha–1 DOY = Julian day ET4w = four-week evapotranspiration, mm P4w = four-week precipitation, mm | ||||
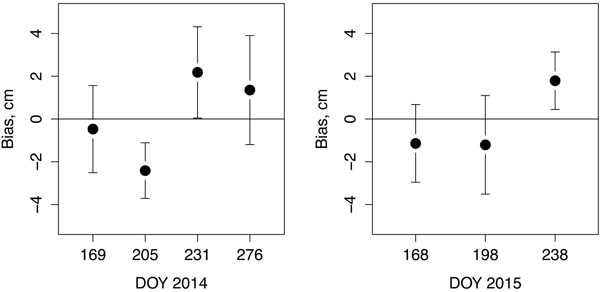
Fig. 2. Mean bias of WTD by Julian days, (DOY) of the final model (Table 3) in the modelling data in years 2014 and 2015. The 95% confidence intervals are shown by bars.
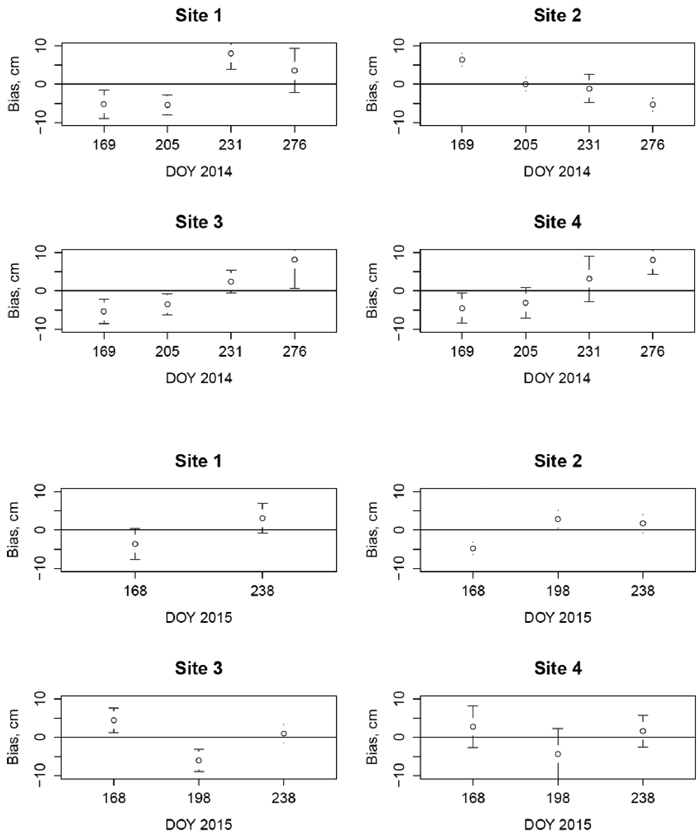
Fig. 3. Mean bias of WTD of the final model (Table 3) by different sites (1–4) by measurement dates (Julian days, DOY) in years 2014 and 2015. The 95% confidence intervals are shown by bars.