| Table 1. The basic stand data estimates for delimbed stems, stumps and logging residues around Kouvola. The abbreviation SD = standard deviation. | |
| Kouvola | |
| Average volume of delimbed stems harvested, dm3 | 28 (SD 12) |
| Average removal, number of delimbed stems per hectare | 1721 (SD 244) |
| Average removal, m3 of delimbed stems harvested per hectare | 48 (SD 20) |
| Average forwarding distance of delimbed stems, m | 219 (SD 37) |
| Average volume of stumps harvested, dm3 | 140 (SD 40) |
| Average diameter of stumps harvested, cm | 34 (SD 4) |
| Average removal, number of stumps per hectare | 444 (SD 203) |
| Average removal, m3 of stumps harvested per hectare | 62 (SD 26) |
| Average forwarding distance of stumps, m | 259 (SD 173) |
| Average removal, m3 of logging residues harvested per hectare | 64 (SD 41) |
| Average forwarding distance of logging residues, m | 261 (SD 172) |
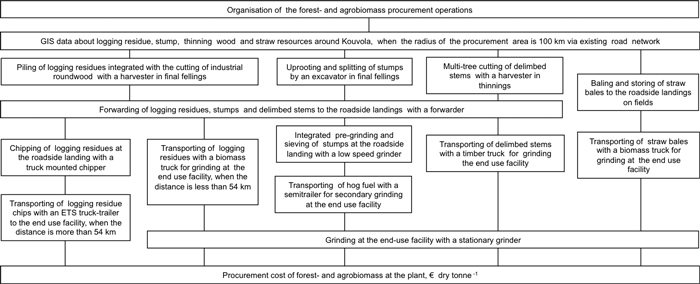
Fig. 1. The supply chains of this study by the main work stages. View larger in new window/tab.
| Table 2. The hourly costs for logging, transporting and comminuting machinery (VAT 0%). | |
| Hourly cost, € | |
| Harvester for cutting delimbed stems | 102.3 |
| Forwarder for forwarding logging residues, stumps and delimbed stems | 81.0 |
| Excavator for lifting and splitting stumps | 80.2 |
| Truck-mounted chipper for chipping logging residues at roadside landings | 213.8 |
| Low-speed grinder for pre-grinding stumps at roadside landings | 185.2 |
| Stationary grinder for grinding forest and agro biomass at the end-use facility | 140.3 |
| Timber truck for transporting delimbed stems | 72.0 |
| Biomass truck for transporting straw bales and loose logging residues | 66.0 |
| Semitrailer unit for transporting pre-ground stumps | 58.0 |
| Truck-trailer unit for transporting logging residue chips | 79.8 |
| Table 3. The productivity parameters for the forest biomass supply chains (Fig. 1). | |||
| Stumps | Logging residues | Delimbed stems | |
| Gross effective time (E15h) coefficient for E0h productivity of cutting/uprooting | 1.4 | - | 1.3 |
| Payload of the forwarder, m³ | 8.6 | 7.8 | 9.0 |
| Gross effective time (E15h) coefficient for E0h productivity of forwarding | 1.2 | 1.2 | 1.3 |
| Payload in transport by road, m³ | 25 | 25 or 38.0–49.9 | 67 |
| Loading time in transport by road, minutes | 44 | 62 or 68.1–81.7 | 50 |
| Unloading time in transport by road, minutes | 27 | 60 or 30 | 37 |
| Grinding productivity at the end-use facility with the stationary grinder, loose-m3 E15h–1 | 270 | 270 | 180 |
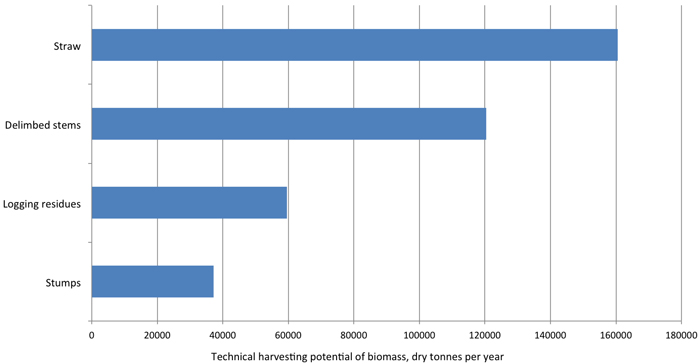
Fig. 2. The technical harvesting potential of forest and cereal straw biomass around the city of Kouvola, within 100 km transporting distance via the existing road network. View larger in new window/tab.
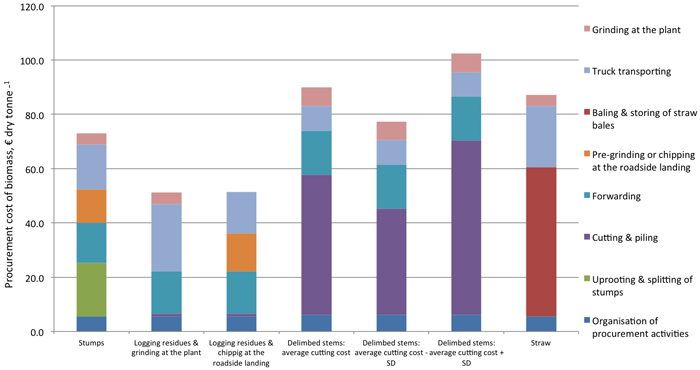
Fig. 3. The procurement cost structure of the supply chains and raw materials of this study. The on-road transportation distance is 54 km and the costs of work phases are based on average values. View larger in new window/tab.
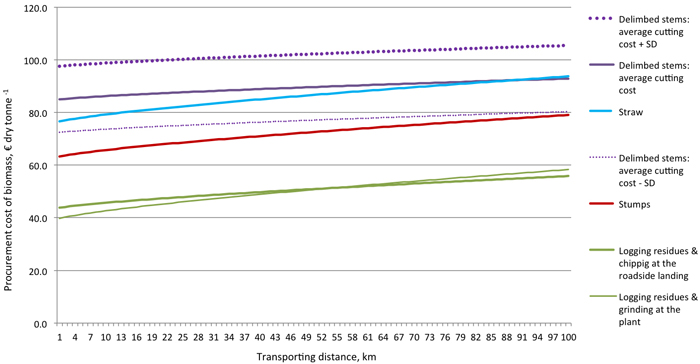
Fig. 4. The procurement cost of the supply chains and raw materials of this study as a function of transportation distance and average costs. View larger in new window/tab.
| Table 4. Average cost values for harvesting forest and cereal straw biomass in the procurement area of Kouvola. The abbreviation SD = standard deviation. | ||||
| Stumps | Logging residues | Delimbed stems | Straw | |
| Average cost of uprooting stumps, cutting & piling of logging residues and delimbed stems or baling of straw: € dry tonne –1 | 19.58 | 1.10 | 51.66 | 43.90 |
| SD | 2.44 | 0.04 | 12.56 | - |
| Min | 15.17 | 1.00 | 24.72 | - |
| Max | 39.08 | 1.23 | 98.93 | - |
| Average cost of off-road transporting: € dry tonne –1 | 14.78 | 15.54 | 16.20 | 8.75 |
| SD | 3.11 | 3.92 | 1.75 | - |
| Min | 10.43 | 9.49 | 10.76 | - |
| Max | 27.18 | 38.02 | 20.88 | - |
| Average cost of on-road transporting: € dry tonne –1 | 18.60 | 17.73 | 10.09 | 23.39 |
| SD | 3.36 | 2.21 | 2.08 | 3.93 |
| Min | 8.30 | 13.52 | 4.06 | 12.69 |
| Max | 22.8 | 25.92 | 13.85 | 29.05 |
| Average cost of comminuting: € dry tonne –1 | 16.50 | 11.33 | 6.84 | 4.21 |
| SD | 0.18 | 3.14 | 0.58 | - |
| Min | 16.00 | 5.58 | 5.68 | - |
| Max | 16.70 | 14.74 | 7.73 | - |
| Average cost of organization: € dry tonne –1 | 5.67 | 5.51 | 6.15 | 5.67 |
| SD | 0.06 | 0.18 | 0.52 | - |
| Min | 5.52 | 5.01 | 5.10 | - |
| Max | 5.75 | 6.16 | 6.94 | - |
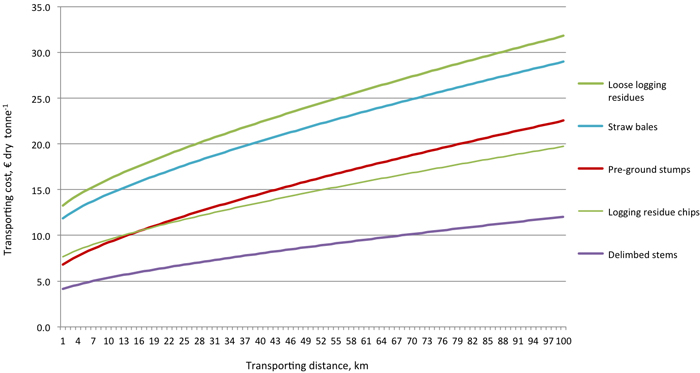
Fig. 5. The transportation costs of raw materials of this study as a function of transportation distance. View larger in new window/tab.
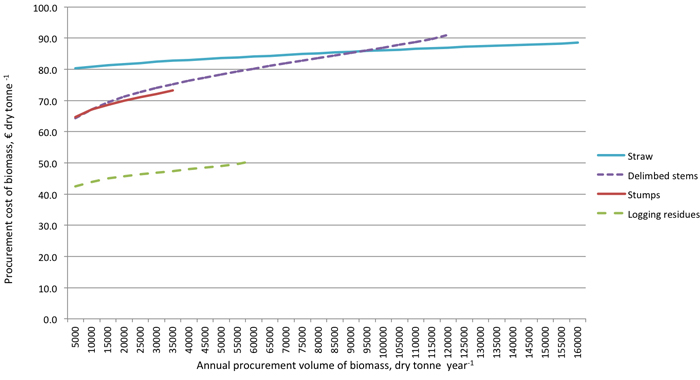
Fig. 6. The procurement cost of forest and agro biomass assortments as a function of annual procurement volume (dry tonne year–1) around Kouvola. View larger in new window/tab.
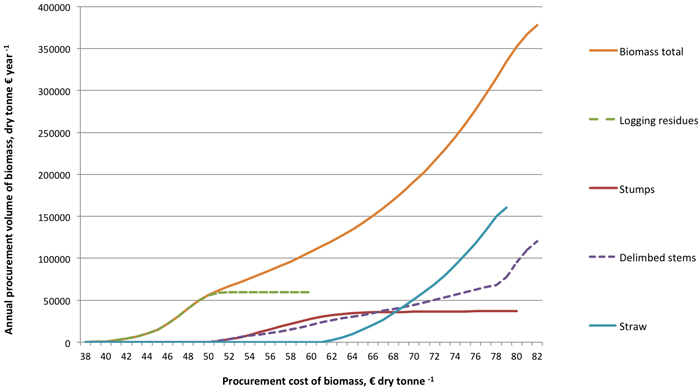
Fig. 7. The annual procurement volume of biomass around Kouvola as a function of procurement cost (€ dry tonne –1). View larger in new window/tab.