| Table 1. Compositions of the experimental nutrient solutions. Concentrations are given in mg l–1. | |||||||||||
| Element | N | P | K | Mg | S | Fe | Mn | Cu | B | Zn | Mo |
| K:N 2.5 (g:g) (Pioner 10-4-25 + mikro) | 12.4 | 5 | 31.6 | 5.5 | 7.1 | 0.3 | 0.09 | 0.03 | 0.04 | 0.05 | 0.01 |
| K:N 3.0 (g:g) (Pioner 10-4-25 + mikro) + MKP*) | 9.9 | 7.4 | 29.6 | 4.4 | 5.7 | 0.3 | 0.09 | 0.03 | 0.04 | 0.05 | 0.01 |
| K:N 3.9 (g:g) (Pioner 10-4-25 + mikro) + MKP*) | 9.9 | 14.2 | 38.2 | 4.4 | 5.7 | 0.3 | 0.09 | 0.03 | 0.04 | 0.05 | 0.01 |
| *) MKP – mono potassium phosphate | |||||||||||
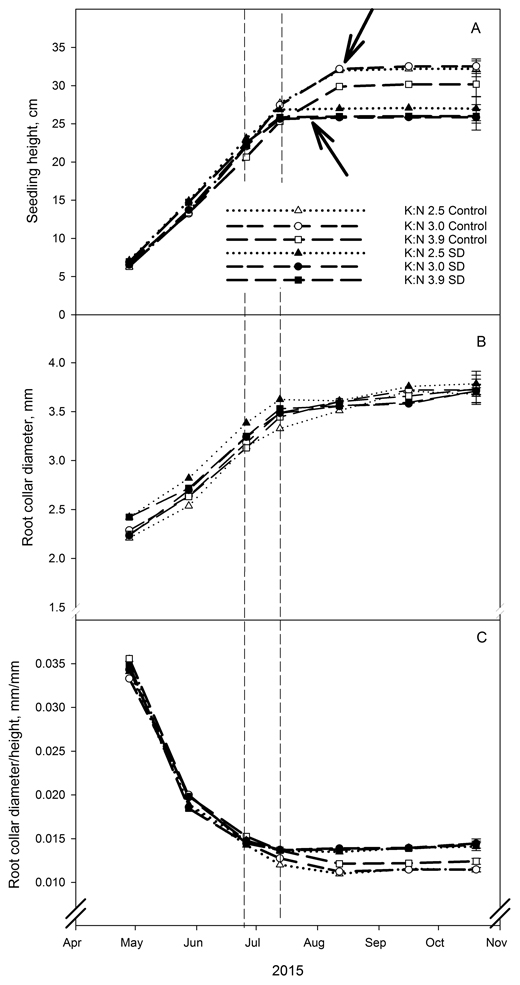
Fig. 1. Root collar diameter (mm) (A), shoot height (cm) (B) and ratio between root collar diameter and shoot height (mm/mm) (C) in Picea abies seedlings that had been given different combinations of photoperiod (SD treatment or control) and nutrients (three different K:N ratios in fertilization). K:N is the potassium:nitrogen (g:g) ratio in the nutrient solution. Broken vertical lines indicate the duration of the SD treatment. The variables were measured on the same ten plants per treatment and replicate at every measurement occasion. Vertical bars denote standard errors. Lower and upper arrows indicate bud formation in SD treated and control seedlings, respectively.
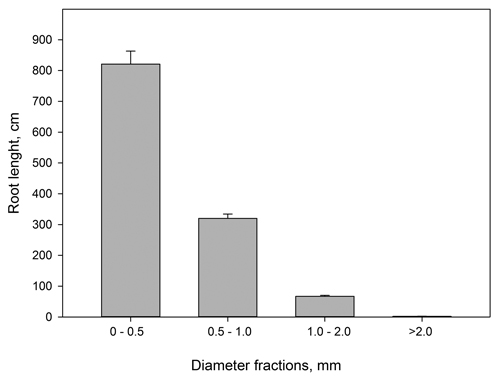
Fig. 2. Current year root lengths (cm) from Picea abies grouped in different diameter classes. n = 46–48. Vertical bars denote standard errors. The figure is based on pooled root length data.
| Table 2. Sum length of roots < 0.5 mm diameter, and dry weight of present year’s roots, from Picea abies seedlings that had received different combinations of photoperiod (SD treatment or control) and nutrients (three different K:N ratios in fertilization) (n = 8). K:N is the potassium:nitrogen (g:g) ratio in the nutrient solution. Different e letters notify significant effect (p < 0.05) within photoperiod treatment as determined by contrast analysis. The values denote mean value per seedling. | ||||||
| Fertilization treatment/ Photoperiod | K:N 2.5/ Control | K:N 3.0/ Control | K:N 3.9/ Control | K:N 2.5/ SD | K:N 3.0/ SD | K:N 3.9/ SD |
| Root length, cm | 661.7a | 590.1a | 979.8b | 860.0a | 838.0a | 998.8a |
| Dry weight, g | 0.606b | 0.460a | 0.624b | 0.657ab | 0.574a | 0.736b |
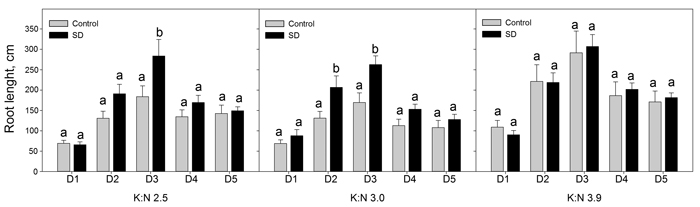
Fig. 3. Sum root lengths of current year roots in diameter classes D1 to D5. The seedlings had been given different combinations of photoperiod (SD treatment or control) and nutrients (three different K:N ratios in fertilization). K:N is the potassium:nitrogen (g:g) ratio in the nutrient solution. The diameter classes were (mm): D1 = 0–0.1; D2 = 0.1–0.2; D3 = 0.2–0.3; D4 = 0.3–0.4; D5 = 0.4–0.5. n = 8. Different letters notify significant effect (p < 0.05) of photoperiod within K:N level and root diameter class. Vertical bars denote standard errors. View larger in new window/tab.
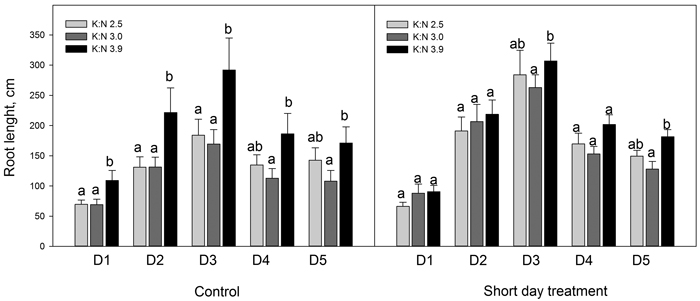
Fig. 4. Sum root lengths of current year roots in diameter classes D1 to D5. The seedlings had been given different combinations of photoperiod (SD treatment or control) and nutrients (three different K:N ratios in fertilization). K:N is the potassium:nitrogen (g:g) ratio in the nutrient solution. The root diameter classes were (mm): D1 = 0–0.1; D2 = 0.1–0.2; D3 = 0.2–0.3; D4 = 0.3–0.4; D5 = 0.4–0.5. n = 8. Different letters notify significant effect (p < 0.05) of K:N level within photoperiod and root diameter class. Vertical bars denote standard errors.
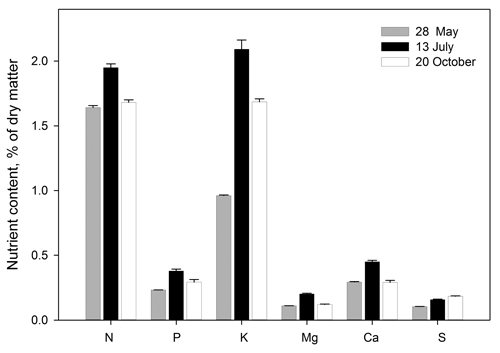
Fig. 5. Element concentrations in Picea abies needles before start of the experimental fertilization treatment (28.05), when terminating the SD treatment (13.07) and following growth cessation in autumn (20.10). The figure is based on pooled data (all 24 observations at each date, i.e. four replications per treatment) because the concentrations of each element were not significantly different from each other among treatments within each date (p < 0.05). Bars denote standard errors.