| Table 1. The number assigned to each Sitka spruce clone planted in the experiment, numbered 1–8. Four clones (1, 3, 5, 8) had common parents, another clone (clone 7) shared a parent with these four clones and clone 2. The remaining two clones (clones 4 and 6) were unrelated to any other clones in this experiment. Clones were propagated using somatic embryogenesis with seeds from controlled crosses of elite parents used in the Irish tree improvement programme. | |
| Clone Number | Cross |
| 1, 3, 5, 8 | 230 × 519 |
| 2 | 377 × 574 |
| 4 | 286 × 542 |
| 6 | 27 × 306 |
| 7 | 377 × 519 |
| Table 2. ANOVA summary for sources of variation and P-values with significant differences in 2013, 2014 and 2015. NS = > 0.05, * = < 0.05, ** = < 0.01 and *** = < 0.001. CV = coefficient of variation. | |||
| P-value | |||
| Source of variation | Clone (C) | Deployment (D) | C × D |
| Year – 2013 | |||
| Absolute stem height, May | * | NS | NS |
| Absolute stem diameter, May | NS | NS | NS |
| Absolute stem height (CV), May | NS | * | NS |
| Absolute stem diameter (CV), May | NS | * | NS |
| Relative stem height, July | * | NS | NS |
| Relative height, mid-July | * | NS | NS |
| Relative height, August | ** | NS | NS |
| Relative stem height, September | NS | * | NS |
| Relative stem diameter, December | NS | ** | NS |
| Year – 2014 | |||
| Relative stem height, May | *** | NS | NS |
| Relative stem height, mid-May | *** | *** | NS |
| Relative stem height, June | ** | *** | NS |
| Relative stem height, mid-June | ** | *** | NS |
| Relative stem height, July | NS | ** | NS |
| Relative stem height, mid-July | NS | * | NS |
| Year – 2015 | |||
| Absolute stem height, August | * | * | * |
| Absolute stem diameter, May | * | * | * |
| Absolute stem height (CV), August | NS | * | NS |
| Absolute stem diameter (CV), May | NS | * | NS |
| Branch biomass | * | NS | NS |
| Total above-ground biomass | * | NS | NS |
| Relative stem height, June | NS | NS | * |
| Table 3. Absolute stem height (May 2013 and August 2015) and diameter at base (May 2013 and 2015) for eight juvenile Sitka spruce clones planted in monoclonal and mixed plots (n = 5) and mean values for all ramets in each deployment-type (n = 10). Data shown are mean values and corresponding coefficient of variation (CV). Values showing the same letter are not statistically significant (P ≤ 0.05). | |||||
| Clone | Deployment Type | Diameter ’13 (mm) | Diameter ’15 (mm) | Height ’13 (cm) | Height ’15 (cm) |
| 1 | Monoclonal | 3.0b (14a) | 6.1ab (15a) | 19.9a (12a) | 56.5a (15a) |
| Mixed | 2.7bc (13a) | 5.9b (18a) | 20.8a (16a) | 55.3ab (19a) | |
| 2 | Monoclonal | 3.3ab (9a) | 6.5ab (9a) | 20.4a (11a) | 57.2a (9a) |
| Mixed | 3.6a (13a) | 7.1a (12a) | 20.1a (17a) | 51.6abc (13a) | |
| 3 | Monoclonal | 3.2ab (18a) | 6.4ab (9a) | 20.6a (17a) | 55.0ab (9a) |
| Mixed | 3.0b (18a) | 6.4ab (9a) | 18.8a (15a) | 50.9abc (9a) | |
| 4 | Monoclonal | 3.2ab (16a) | 5.8b (11a) | 20.8a (17a) | 47.1bc (11a) |
| Mixed | 2.8bc (16a) | 6.3ab (18a) | 20.6a (18a) | 49.8abc (18a) | |
| 5 | Monoclonal | 2.6c (16a) | 7.0a (10a) | 21.1a (17a) | 51.8ab (16a) |
| Mixed | 2.8c (17a) | 5.9b (11a) | 18.8a (18a) | 43.8c (18a) | |
| 6 | Monoclonal | 3.3ab (15a) | 6.3ab (6a) | 23.0a (12a) | 47.9bc (7a) |
| Mixed | 3.0b (12a) | 6.0ab (12a) | 21.8a (18a) | 49.8abc (16a) | |
| 7 | Monoclonal | 3.1b (14a) | 5.9b (7a) | 19.1a (12a) | 43.1c (7a) |
| Mixed | 2.8bc (17a) | 6.4ab (16a) | 17.6a (17a) | 50.2abc (16a) | |
| 8 | Monoclonal | 2.6c (15a) | 5.7b (11a) | 18.9a (15a) | 49.6abc (12a) |
| Mixed | 2.5c (14a) | 5.8b (11a) | 17.7a (14a) | 45.2bc (11a) | |
| Mean monoclonal values | 3.1a (15b) | 20.5a (15b) | 6.1a (10b) | 50.5a (11b) | |
| Mean mixed values | 2.9a (22a) | 19.7a (19a) | 6.1a (20a) | 49.1a (18a) | |
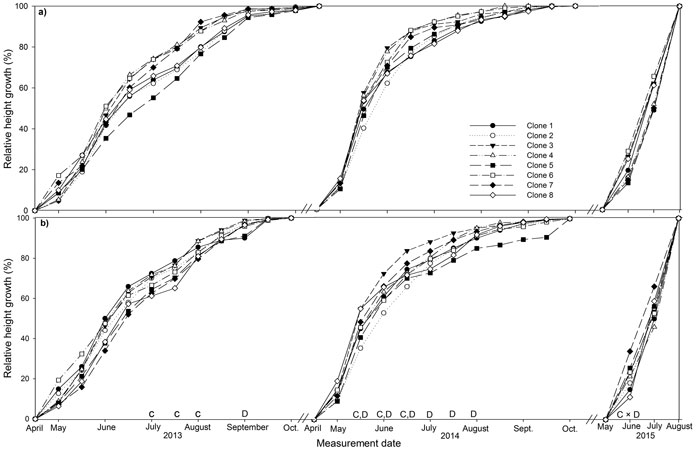
Fig. 1. Stem height relative to final height over the three years (2013, 2014, 2015) of the experiment for eight juvenile clones of Sitka spruce in (a) monoclonal and (b) multi-clonal mixtures. Letters above dates indicate statistically significant (P ≤ 0.05) differences between clones (C), deployment type (D) and clone × deployment type (C × D). View larger in new window/tab
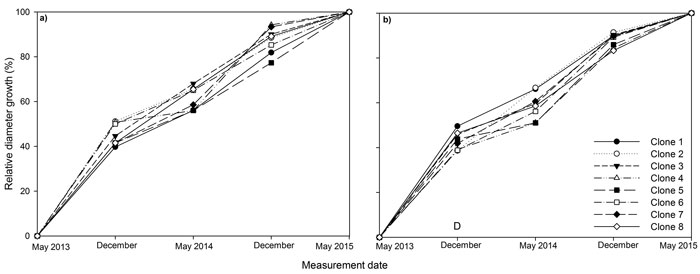
Fig. 2. Stem diameter at base relative to final stem diameter at base over the three years (2013, 2014, 2015) of the experiment for eight juvenile Sitka spruce clones in (a) monoclonal and (b) multi-clonal mixtures. A statistically significant (P ≤ 0.05) difference between deployment type (D) occurred in December 2013. View larger in new window/tab
| Table 4. Biomass partitioning of eight juvenile Sitka spruce clones in January 2015. Data shown are mean values ± 1 SE (standard error). Means showing the same letter are not statistically significant (P ≤ 0.05). n = 10. | |||
| Biomass Partitioning | |||
| Year | Clone | Branch (g) | Total above-ground biomass (g) |
| 2015 | 1 | 1.23 ± 0.2ab | 12.89 ± 1.5b |
| 2 | 1.88 ± 0.3a | 17.26 ± 1.0a | |
| 3 | 1.27 ± 0.3ab | 12.98 ± 1.4b | |
| 4 | 1.33 ± 0.3ab | 12.24 ± 0.6b | |
| 5 | 1.71 ± 0.4ab | 11.77 ± 2.0b | |
| 6 | 1.50 ± 0.3ab | 12.83 ± 1.6b | |
| 7 | 1.11 ± 0.3b | 11.22 ± 1.9b | |
| 8 | 1.16 ± 0.3b | 12.08 ± 1.7b | |
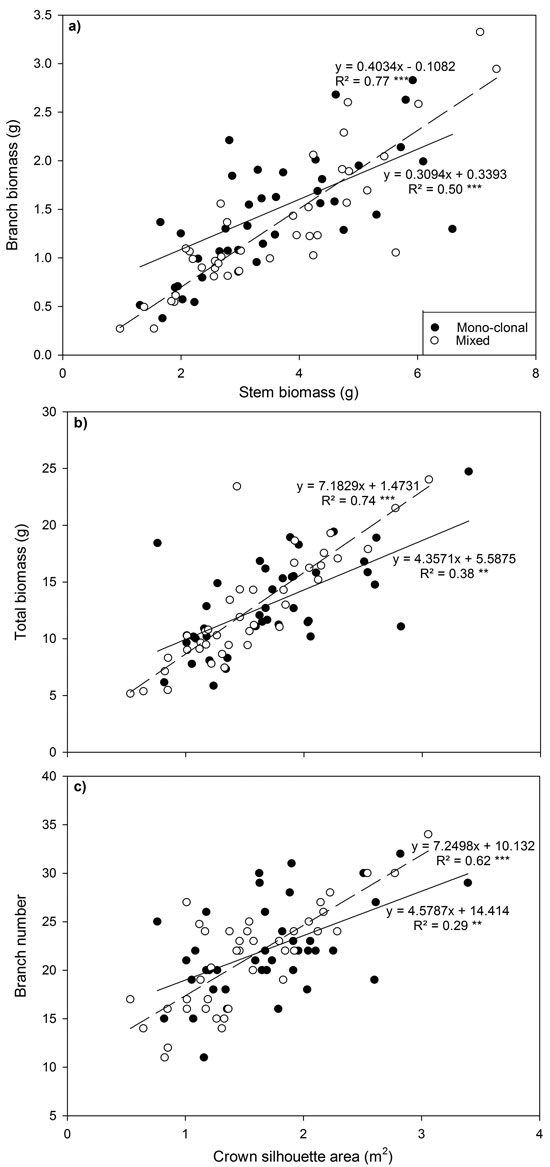
Fig. 3. Relationship between (a) branch biomass and stem biomass, (b) total biomass and crown silhouette area (CSA) and (c) branch number and CSA for all Sitka spruce ramets planted in monoclonal and clonal mixtures in January 2015. Symbols indicate deployment-type. Lines represent linear regressions for each deployment type; solid lines = monoclonal plots, dashed lines = mixed plots. ** = P < 0.01; ***= P < 0.001. Each point represents a ramet.
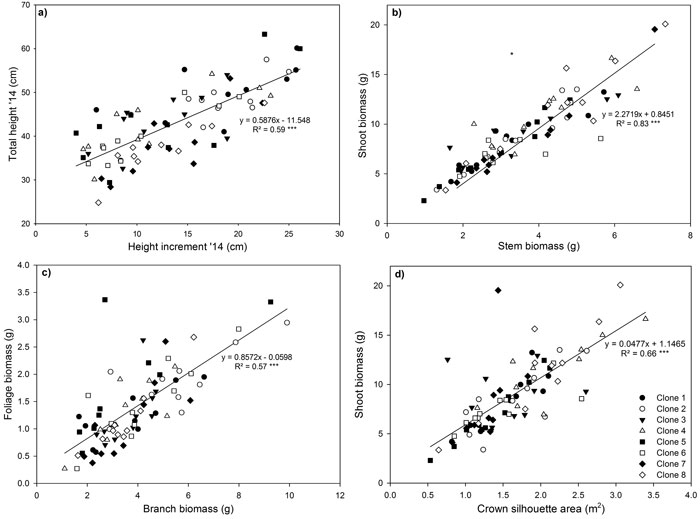
Fig. 4. Relationship between (a) shoot height increment in 2014 and total stem height in 2014, (b) shoot and stem biomass (c) foliage and branch biomass and (d) shoot biomass and crown silhouette area for eight Sitka spruce ramets planted in monoclonal and multi-clonal mixtures in January 2015. Lines represent linear regressions, *** = P < 0.001. Each point represents a ramet. View larger in new window/tab