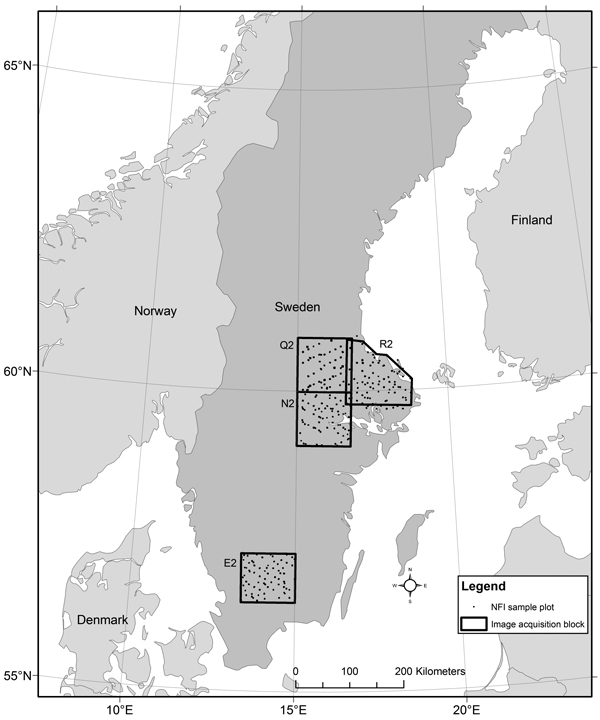
Fig. 1. The location of the four sub-areas (E2, N2, Q2 and R2) on a background map of the Nordic countries (©ESRI).
| Table 1. Data collection year for sub-areas E2, N2, Q2 and R2. |
| E2 | N2 | Q2 | R2 |
| NFI plots | 2012–2013 | 2012–2013 | 2012–2013 | 2013–2014 |
| Company stands | 2014 | - | 2015 | 2015 |
| Biotope stands | 2012–2014 | - | 2012–2015 | 2012–2015 |
| Aerial images | leaf-on 2013 | leaf-on 2014 | leaf-off 2014 | leaf-on 2015 |
| LiDAR data | 2010–2012 | 2010–2012 | 2009–2011 | 2009–2012 |
| Table 2. Summary of basal area weighted mean height (Hbw), basal area weighted mean diameter (Dbw), stem volume (Vol), and basal area (BA) of the training data for sub-areas E2, N2, Q2 and R2. Species proportion is proportion of basal area. |
| Characteristic | Minimum | Maximum | Mean | Standard
deviation |
| E2, n = 216 plots |
| Hbw, m | 3.0 | 28.2 | 14.3 | 6.2 |
| Dbw, cm | 1.3 | 43.4 | 18.2 | 9.4 |
| BA, m2 ha–1 | 0.7 | 61.3 | 21.3 | 12.4 |
| Vol, m3 ha–1 | 2.4 | 669.1 | 168.6 | 131.1 |
| Pine proportion (%) | 0 | 100 | 21 | 31 |
| Spruce proportion (%) | 0 | 100 | 49 | 36 |
| Deciduous proportion (%) | 0 | 100 | 30 | 35 |
| N2, n = 167 plots |
| Hbw, m | 3.0 | 30.8 | 15.9 | 6.1 |
| Dbw, cm | 3.5 | 42.8 | 21.0 | 9.1 |
| BA, m2 ha–1 | 1.0 | 50.8 | 22.3 | 10.4 |
| Vol, m3 ha–1 | 2.7 | 627.1 | 181.4 | 117.7 |
| Pine proportion (%) | 0 | 100 | 34 | 36 |
| Spruce proportion (%) | 0 | 100 | 38 | 32 |
| Deciduous proportion (%) | 0 | 100 | 28 | 32 |
| Q2, n = 223 plots |
| Hbw, m | 3.1 | 28.4 | 15.0 | 5.9 |
| Dbw, cm | 2.8 | 41.2 | 19.0 | 8.4 |
| BA, m2 ha–1 | 2.7 | 50.5 | 22.0 | 9.9 |
| Vol, m3 ha–1 | 6.6 | 547.9 | 174.9 | 119.6 |
| Pine proportion (%) | 0 | 100 | 49 | 37 |
| Spruce proportion (%) | 0 | 100 | 34 | 32 |
| Deciduous proportion (%) | 0 | 100 | 17 | 25 |
| R2,n = 233 plots |
| Hbw, m | 3.0 | 29.8 | 17.0 | 6.1 |
| Dbw, cm | 1.0 | 45.4 | 22.5 | 9.3 |
| BA, m2 ha–1 | 0.1 | 59.8 | 23.8 | 12.1 |
| Vol, m3 ha–1 | 0.46 | 701.5 | 207.9 | 144.3 |
| Pine proportion (%) | 0 | 100 | 37 | 36 |
| Spruce proportion (%) | 0 | 100 | 39 | 34 |
| Deciduous proportion (%) | 0 | 100 | 24 | 32 |
| Table 3. Summary of basal area weighted mean height (Hbw), basal area weighted mean diameter (Dbw), stem volume (Vol), and basal area (BA) of the validation data for sub-areas E2, Q2 and R2. Species proportion is proportion of basal area. |
| Company stands | Biotope stands |
| Characteristic | Min | Max | Mean | Std | Min | Max | Mean | Std |
| E2, Company stands: n = 25; Biotope stands: n = 10 | |
| Hbw, m | - | - | - | | - | - | - | - |
| Dbw, cm | 13 | 31 | 21.9 | 4.9 | - | - | - | - |
| BA, m2 ha–1 | 12.6 | 42.7 | 25.9 | 7.3 | - | - | - | - |
| Vol, m3 ha–1 | 91 | 380 | 211 | 75.6 | 144.4 | 357.0 | 262.5 | 66.3 |
| Pine prop. (%) | - | - | - | - | - | - | - | - |
| Spruce prop. (%) | - | - | - | - | - | - | - | - |
| Deciduous prop. (%) | - | - | - | - | 30 | 100 | 87 | 21 |
| Q2, n = 37/11 |
| Hbw, m | 10.5 | 24.8 | 17.8 | 3.7 | - | - | - | - |
| Dbw, cm | 12.2 | 30.6 | 22.7 | 5.2 | - | - | - | - |
| BA, m2 ha–1 | 12.0 | 47.0 | 21.8 | 8.8 | - | - | - | - |
| Vol, m3 ha–1 | 65 | 540 | 219.0 | 106.4 | 179.3 | 508.8 | 341.0 | 95.1 |
| Pine prop. (%) | 0 | 100 | 57 | 32 | - | - | - | 0 |
| Spruce prop. (%) | 0 | 98 | 35 | 28 | - | - | - | 0 |
| Deciduous prop. (%) | 0 | 69 | 8 | 13 | 1 | 79 | 23 | 27 |
| R2, n = 82/18 |
| Hbw, m | 9.1 | 24.9 | 18.9 | 3.7 | - | - | - | - |
| Dbw, cm | 8.4 | 40.0 | 25.4 | 6.1 | - | - | - | - |
| BA, m2 ha–1 | 12.0 | 50.0 | 27.4 | 8.4 | - | - | - | - |
| Vol, m3 ha–1 | 61.0 | 509.0 | 243.3 | 101.3 | 254 | 481 | 349 | 67.0 |
| Pine prop. (%) | 0 | 100 | 46 | 33 | - | - | - | - |
| Spruce prop. (%) | 0 | 99 | 42 | 30 | - | - | - | - |
| Deciduous prop. (%) | 0 | 98 | 12.4 | 16 | 2 | 78 | 22 | 21 |
| Table 4. Description of strata and number of plots (N.) used in performance assessment of predictions. Hbw = basal area weighted mean height and BA = basal area. |
| Strata | Description | N. image | N. LiDAR |
| All | All plots | 839 | 856 |
| Deciduous | Proportion of deciduous trees > 50% | 169 | 157 |
| Conifer | Proportion of conifer trees > 50% | 670 | 699 |
| Pine dom. | Proportion of pine > proportion of spruce or proportion of deciduous trees | 318 | 349 |
| Spruce dom. | Proportion of spruce > proportion of pine or proportion of deciduous trees | 336 | 334 |
| Young | Hbw < 15 meter | 363 | 367 |
| Mature | Hbw > = 15 meter | 476 | 489 |
| Mature sparse | Hbw > = 15 meter and BA < 20 | 101 | 106 |
| Mature dense | Hbw > = 15 meter and BA > 35 | 103 | 106 |
| Table 5. Image based model statistics and plot level performance for basal area weighted mean height (Hbw), basal area weighted mean diameter (Dbw), stem volume (Vol), and basal area (BA) in different sub-areas. VRx is the vegetation ratio, i.e. the proportion of points over a threshold x divided by the total number of points. mCHM0 = mean CHM with Nodata set to zero. Other metrics are calculated by FUSION (McGaughey 2015). Bias was less than 0.1% in each case. * Square root transformation of Y-variable was used and back-transformed. |
| Dataset | Stand attribute | Metrics | R2 adjusted | RMSE | RMSE (%) |
| E2 | Hbw | Elev.P95 | 0.90 | 1.9 | 13.5 |
| Dbw | Elev.LCV, Elev.P95 | 0.86 | 3.6 | 19.6 |
| Vol* | Elev.minimum, Elev.CURT.mean.CUBE | 0.88 | 55.0 | 32.6 |
| BA | Elev.mean | 0.73 | 6.4 | 29.8 |
| N2 | Hbw | Elev.P95 | 0.90 | 1.9 | 12.0 |
| Dbw | Elev.P95 | 0.79 | 4.1 | 19.7 |
| Vol | CanopyReliefRatio, Elev.CURT.mean.CUBE | 0.74 | 59.9 | 32.9 |
| BA | Elev.maximum, VR70%.Elev.P95 | 0.62 | 6.4 | 28.7 |
| Q2 | Hbw | Elev.P95 | 0.92 | 1.7 | 11.1 |
| Dbw | Elev.stdev, Elev.P95 | 0.82 | 3.5 | 18.5 |
| Vol* | Elev.CURT.mean.CUBE | 0.84 | 55.3 | 31.6 |
| BA* | Elev.P99, mCHM0 | 0.69 | 5.7 | 26.0 |
| R2 | Hbw | Elev.P95 | 0.93 | 1.6 | 9.5 |
| Dbw | Elev.P95, Elev.LCV | 0.84 | 3.7 | 16.6 |
| Vol* | Elev.SQRT.mean.SQ, VR5 | 0.83 | 60.0 | 28.8 |
| BA | Elev.minimum, Elev.CURT.mean.CUBE | 0.69 | 6.7 | 28.1 |
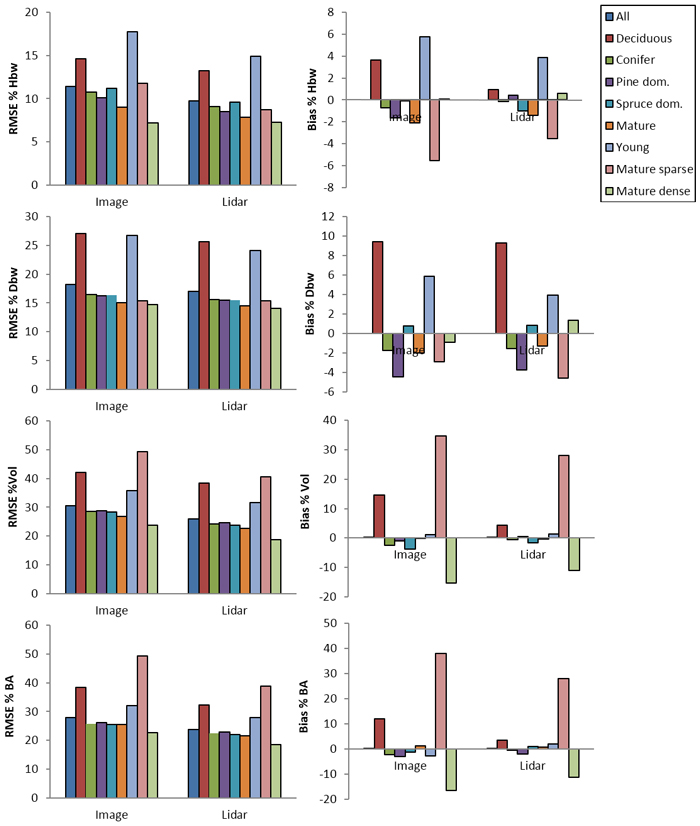
Fig. 2. RMSE in percent of mean and bias in percent of mean for mean height (Hbw), mean diameter (Dbw), stem volume (Vol) and basal area (BA) in different strata based on all plots for image and LiDAR models.
| Table 6. Stand level accuracies for basal area weighted mean height (Hbw), basal area weighted mean diameter (Dbw), stem volume (Vol), and basal area (BA) in different sub-areas (all stands). |
| Dataset | Stand attribute | RMSE | RMSE (%) | Bias (%) |
| E2 | Hbw, m | - | - | - |
| Dbw, cm | 3.9 | 17.8 | –6.8 |
| Vol, m3 ha–1 | 51.3 | 22.7 | 0.4 |
| BA, m2 ha–1 | 4.6 | 17.7 | –3.6 |
| Q2 | Hbw, m | 1.9 | 10.5 | –9.1 |
| Dbw, cm | 2.9 | 12.7 | –9.6 |
| Vol, m3 ha–1 | 55.4 | 22.4 | –9.3 |
| BA, m2 ha–1 | 4.6 | 18.6 | –5.0 |
| R2 | Hbw, m | 1.5 | 7.7 | –0.4 |
| Dbw, cm | 3.1 | 12.0 | –5.3 |
| Vol, m3 ha–1 | 57.4 | 22.0 | –6.7 |
| BA, m2 ha–1 | 5.8 | 21.1 | –6.1 |
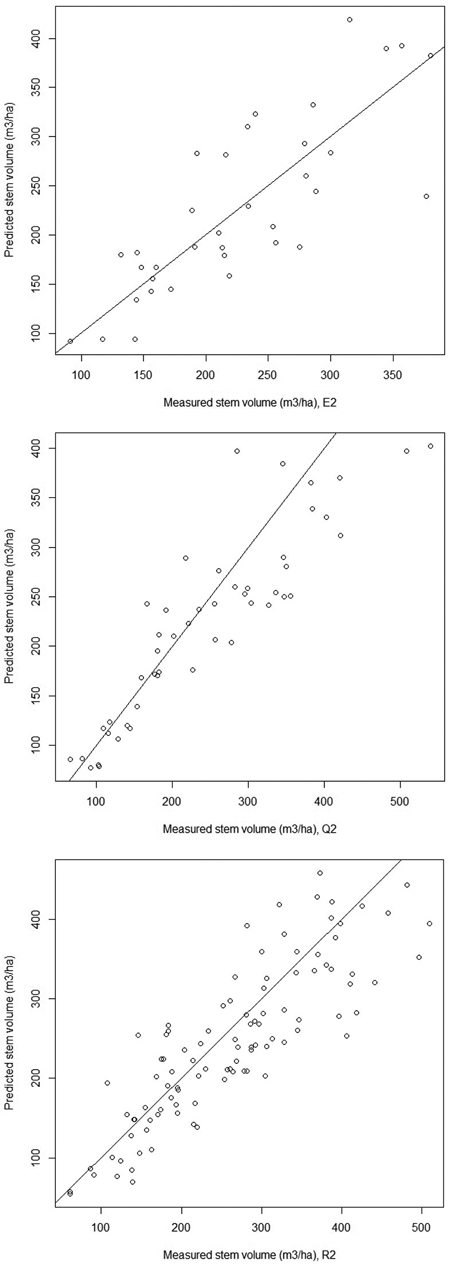
Fig. 3. Stand level stem volumes (m3 ha–1) in sub-areas; E2, Q2 and R2, based on field measurements and image data.
| Table 7. Stand level accuracies of forest attributes in combined datasets. Hbw = basal area weighted mean height and Dbw = basal area weighted mean diameter. |
| Characteristic | RMSE | RMSE (%) | Bias (%) |
| Company stands, n = 144 |
| Hbw, m | 1.6 | 8.6 | –5.6 |
| Dbw, cm | 2.7 | 11.0 | –5.6 |
| Basal area, m2 ha–1 | 5.3 | 20.2 | –5.4 |
| Stem volume, m3 ha–1 | 54.8 | 23.7 | –7.8 |
| Biotope stands, n = 39 |
| Stem volume, m3 ha–1 | 61.2 | 18.9 | –2.2 |
| All stands, n = 183 |
| Stem volume, m3 ha–1 | 55.7 | 22.2 | –6.1 |
| Table 8. RMSE% and Bias% of stem volume using models from different sub-areas to company stand of Q2 and R2. |
| Model-area | RMSE (%) | Bias (%) |
| Q2-Q2 | 23.0 | –11.5 |
| E2-Q2 | 19.2 | –8.3 |
| R2-Q2 | 25.3 | –17.3 |
| R2-R2 | 24.1 | 5.3 |
| E2-R2 | 22.4 | 0.9 |
| Q2-R2 | 24.6 | 2.0 |