| Table 1. Description of the conditions at the three study sites located in the south, northeastern and northwestern parts of Sweden respectively, including plot setup, number of seedlings planted and seedling material details for the three sites and for Scots pine, Norway spruce and silver birch respectively. Growing season, mean annual temperature and mean annual precipitation extrapolated for the Swedish Meteorological and Hydrological Institute (SMHI) maps showing normal length of vegetation period 1981–2010 (SMHI 2022a-d). All seedlings were containerized. *Theoretical numbers since the true number for each row sometimes deviated depending on availability of planting positions. **Approximate mean sizes common for the container system, not actual measurements of the seedlings. | ||||
| Site | South (S) site | Northeast (NE) site | Northwest (NW) site | |
| Coordinates | 57.193157,14.821763 | 64.162174, 19.661918 | 64.102337, 18.149540 | |
| Elevation (m. a.s.l) | 225–230 | 160–165 | 295–300 | |
| Trial establishment date | June 17th 2020 | June 22nd 2020 | June 17th 2019 | |
| Landowner | Sveaskog | Private | Sveaskog | |
| Growing season (days) | 190–200 | 150–160 | 140–150 | |
| Coldest month avg. T (°C) | –1 to –2 (January) | –7 to –8 (January | –9 to –10 (January) | |
| Warmest month avg. T (°C) | +16 to +17 (July) | +15 to +16 (July) | +14 to +15 (July) | |
| Mean annual T (°C) | 6–7 | 2–3 | 1–2 | |
| Mean annual precipitation (mm) | 600–800 | 600–800 | 400–600 | |
| Moist class | mesic to dry | mesic | dry–mesic | |
| Harvested stand | spruce | spruce | pine | |
| Landscape | Hummocky, but with relatively flat plot areas | From flat to moderate W slope | Ridges, from flat to gentle slope | |
| Vegetation type | Grass + Rubus idaeus L. | Vaccinium myrtillus L. | Vaccinium myrtillus L. + Vaccinium vitis-idaea L. | |
| Vegetation 2nd season | Very rich | Moderate | Sparse | |
| Tot. size harvested area (ha) | 21 | 5 | 20 | |
| Seedlings per plot* | 9 × 9 | 9 × 9 | 12 × 12 | |
| Seedling spacing (m) | 2.6 × 2.6 | 2.6 × 2.6 | 2 × 2 | |
| Seedling material | ||||
| Pine | Age (yr) | 1 | 1 | 2 |
| Nursery | Lilla Istad, SSP | Skogforsk, Sävar | Skadom nursery | |
| Seed origin | Seed orchard | Seed orchard | Seed orchard | |
| Provenience | 30-G7 Lilla Istad | FP-T8 Dal | FP 625 T8 Dal | |
| Container system | S50 | Hiko VAB90 | SP90 | |
| Height (cm)** | 13 | 13.2 | 25 | |
| Stem base (mm)** | 2.45 | 3.1 | 5 | |
| Pine-weevil protection | yes, conniflex | no | no | |
| Spruce | Age (yr) | 1.5 | 1 | 2 |
| Nursery | Trekantens nursery, SSP | Skogforsk, Sävar | Skadom nursery | |
| Seed origin | Seed orchard | Seed orchard | Forest | |
| Provenience | FT-907 Ekebo | FP-130 Domsjöänget | Fullsborn 61*25 | |
| Container system | Svepot 115 | Hiko VAB90 | SP90 | |
| Height (cm)** | 30.5 | 24.4 | 30 | |
| Stem base (mm)** | 4.6 | 3.1 | 6 | |
| Pine-weevil protection | yes, conniflex | no | no | |
| Birch | Age (yr) | 1 | 1 | 1 |
| Nursery | Mellanå Plant AB | Skogforsk, Sävar | Skadom nursery | |
| Seed origin | Seed orchard | Seed orchard | Seed orchard | |
| Provenience | Ekebo 5 B | Lat 62–64° (Finland) | SV 413 Oitti (Finland) | |
| Container system | PLEK 36 | Plantek 49F | SP120 | |
| Height (cm)** | 40–80 | N.A. | 40 | |
| Stem base (mm)** | N.A. | N.A. | 6 | |
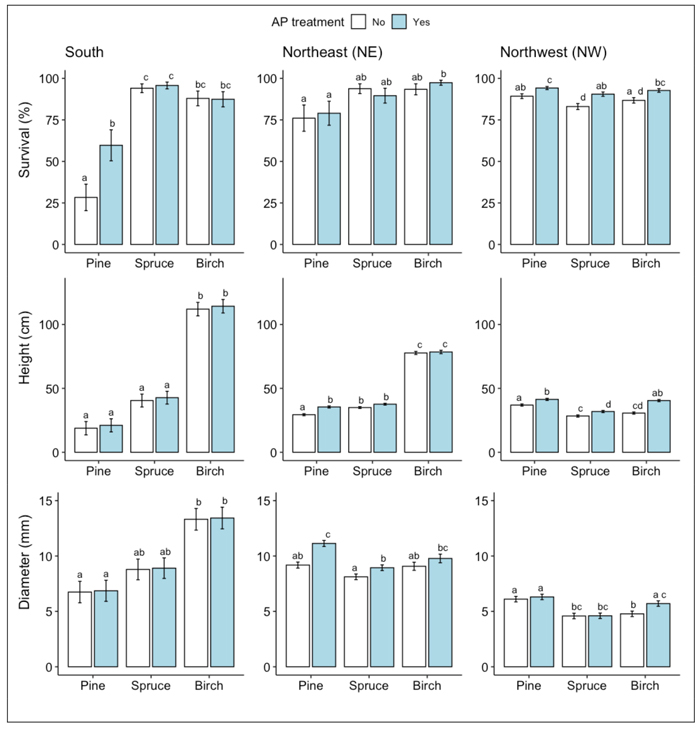
Fig. 1. Results from ANOVA analysis for A) survival, B) height, and C) stem base diameter means of Scots pine, Norway spruce and silver birch at each site respectively following the second field season. Columns indicate percentage survival and error bars indicate standard error (data backtransformed from log scale in survival models). Different letters indicate significant differences. For height and stem base diameter, only measurements of seedlings classified as vital are included.
| Table 2. ANOVA (Type II/III Wald chi-square tests) on generalized mixed linear models for probability of survival and linear mixed models for height and stem base diameter for each site following the second growing season in the field. Significant results are highlighted in bold. | |||||||||
| South (S) | Northeast (NE) | Northwest (NW) | |||||||
| Survival | X2 | df | Pr(>X2) | X2 | df | Pr(>X2) | X2 | df | Pr(>X2) |
| AP | 8.26 | 1 | 0.004 | 0.99 | 1 | 0.319 | 19.19 | 1 | <0.001 |
| Species | 34.57 | 2 | <0.001 | 8.40 | 2 | 0.015 | 8.79 | 2 | 0.012 |
| AP × Species | 13.44 | 2 | 0.001 | 8.92 | 2 | 0.012 | - | - | - |
| Height | |||||||||
| AP | 2.55 | 1 | 0.1103 | 17.12 | 1 | <0.001 | 137.51 | 1 | <0.001 |
| Species | 177.43 | 2 | <0.001 | 2089.17 | 2 | <0.001 | 80.16 | 2 | <0.001 |
| AP × Species | - | - | - | 8.57 | 2 | 0.014 | 30.34 | 2 | <0.001 |
| Diameter | |||||||||
| AP | 0.20 | 1 | 0.65 | 44.94 | 1 | <0.001 | 25.55 | 1 | <0.001 |
| Species | 24.46 | 2 | <0.001 | 23.81 | 2 | <0.001 | 23.14 | 2 | <0.001 |
| AP × Species | - | - | - | 13.80 | 2 | 0.001 | 27.17 | 2 | <0.001 |
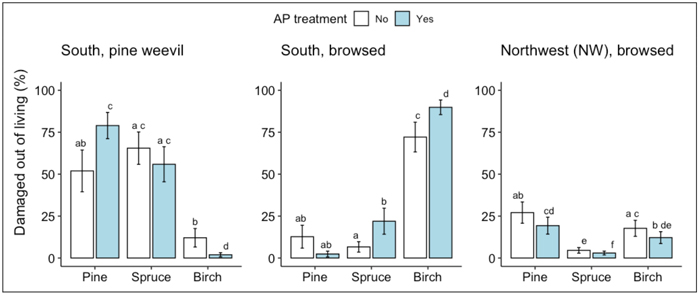
Fig. 2. Results from ANOVA analysis for damage to living seedlings of Scots pine, Norway spruce and silver birch by A) pine weevil and B) browsing at the south site, and C) browsing at the NW site following the second field season. Columns indicate percentage of living seedlings damaged and error bars indicate standard error (data backtransformed from log scale used in models.) Different letters indicate significant differences.
| Table 3. ANOVA (Type II/III Wald chi-square tests) on generalized mixed linear models for probability of registered damage following the second growing season in the field; browsing and pine weevil for the south site and browsing for the northwest site. Significant results are highlighted in bold. | |||||||||
| South, pine weevil | South, browsing | Northwest, browsing | |||||||
| Damage | X2 | df | Pr(>X2) | X2 | df | Pr(>X2) | X2 | df | Pr(>X2) |
| AP | 2.81 | 1 | 0.094 | 0.95 | 1 | 0.331 | 9.70 | 1 | 0.002 |
| Species | 32.29 | 2 | <0.001 | 47.52 | 2 | <0.001 | 17.84 | 2 | <0.001 |
| AP × Species | 27.74 | 2 | <0.001 | 17.22 | 2 | <0.001 | - | - | - |