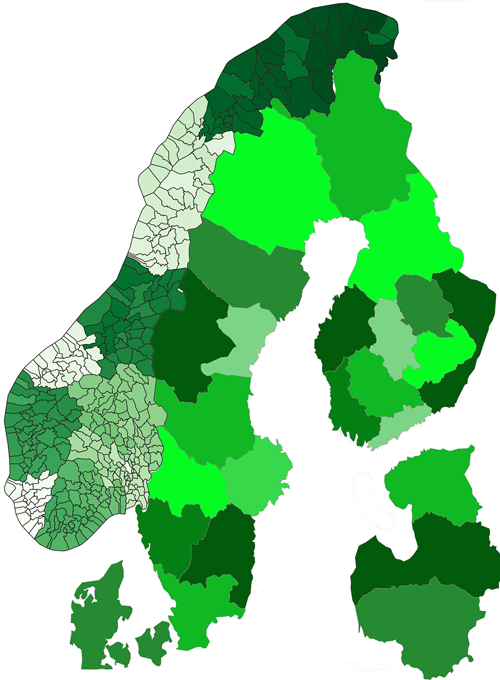
Fig. 1. The modelled regions in the Nordic Forest Sector Model (NFSM). Where Norway is refined into 356 municipalities, Sweden and Finland are divided into 10 regions, respectively, while Denmark and the Baltic countries are modelled as one region each. In total are 380 regions modelled detailed and 4 abroad importing and exporting region is included as well (not shown).
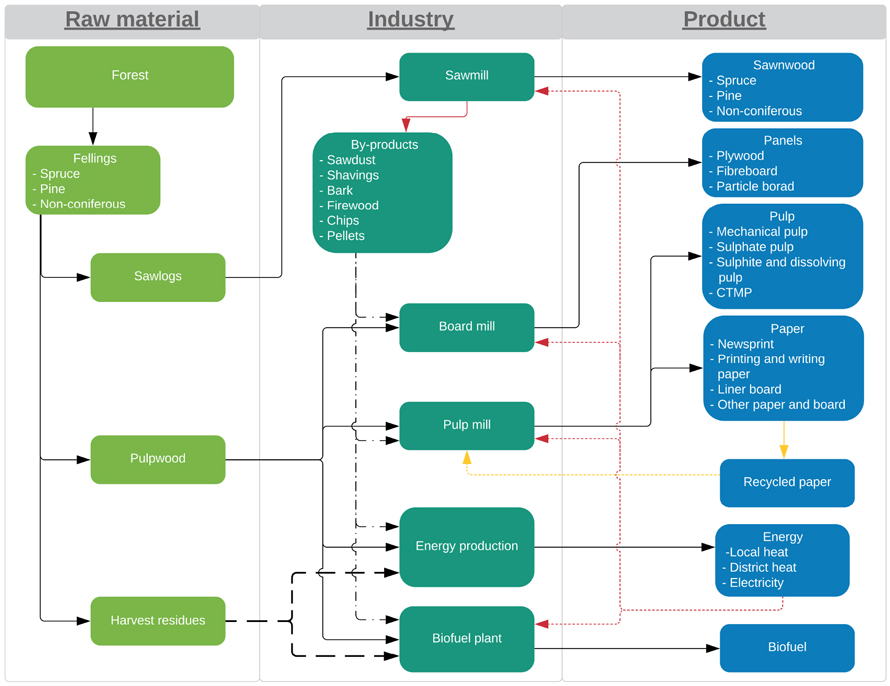
Fig. 2. Flowchart of the mass flow in the Nordic Forest Sector Model (NFSM) with raw materials, main industrial processes, intermediate biomass flow, and final products. View larger in new window/tab.
| Table 1. Reference data for the Nordic forest sector used in the Nordic Forest Sector Model (NFSM). The table shows aggregated number used for calibrating the model and representing the initial production without biofuel production in Norway. | |||||||
| Norway | Sweden | Finland | Denmark | Baltics | |||
| Industrial production | Bioheat | TWh | 8.4 | 104.9 | 71.1 | 20.8 | 33.6 |
| Board | million m3 | 0.7 | 1.0 | 1.2 | 0.4 | 3.1 | |
| Sawn wood | million m3 | 3.4 | 21.1 | 13.3 | 0.4 | 5.5 | |
| Firewood | million m3 | 2.4 | 5.1 | 4.8 | 2.3 | 7.4 | |
| Charcoal and pellets | million tonnes | 0.1 | 2.0 | 0.8 | 0.1 | 4.0 | |
| Paper | million tonnes | 1.2 | 9.8 | 8.2 | 0.4 | 0.5 | |
| Pulp production | million tonnes | 0.4 | 13.0 | 11.1 | 0.0 | 0.3 | |
| Table 2. Reference growing stock, harvest, roundwood prices, and the price elasticity of roundwood supply used in the Nordic Forest Sector Model. Sources: (FAOSTAT 2022; Landbruksdirektoratet 2022; Luke 2022a,b; Rørstad et al. 2022; Skogstyrelsen 2022; Statistics Denmark 2022). | ||||||
| Norway | Sweden | Finland | Denmark | Baltics | ||
| Price elasticity of roundwood supply | Sawlogs | 0.73–1.67 | 1.39 | 1.39 | 1.28 | 1.28 |
| Pulpwood | 0.69–1.67 | 0.78 | 0.78 | 0.72 | 0.72 | |
| Roundwood prices [€/m3 ub.] | Spruce sawlogs | 66 | 70 | 66 | 69 | 68 |
| Spruce pulpwood | 30 | 33 | 33 | 32 | 32 | |
| Pine sawlogs | 61 | 64 | 66 | 68 | 62 | |
| Pine pulpwood | 24 | 29 | 32 | 32 | 28 | |
| Non-coniferous sawlogs | 67 | 69 | 77 | 66 | 65 | |
| Non-coniferous pulpwood | 42 | 36 | 41 | 36 | 35 | |
| Harvest [million m3 ub.] | Spruce (Picea abies) | 9 | 42 | 23 | 3 | 9 |
| Pine (Pinus sylvestris) | 3 | 26 | 27 | 1 | 8 | |
| Non-coniferous/other | 2 | 16 | 12 | 3 | 19 | |
| Sawlogs share of the total harvest | 59% | 55% | 50% | 25% | 56% | |
| Growing stock [million m3 ub.] | Spruce (Picea abies) | 406 | 1210 | 630 | 42 | 340 |
| Pine (Pinus sylvestris) | 258 | 1204 | 1040 | 13 | 552 | |
| Non-coniferous/other | 209 | 551 | 364 | 77 | 739 | |
| Table 3. The assumed price elasticity for the main product categories, as well as the reference base price for the different product categories. The prices are shown with the maximal variation in prices. The prices variating between the different products that are within each product group as well as between the region, based on the different transport distances. Based on own assumption and FAOSTAT (2022) and Buongiorno (2015). | |||||||
| Price elasticity | Reference prices | ||||||
| Norway | Sweden | Finland | Denmark | Baltics | Unit | ||
| Sawnwood | –0.17 | 171–486 | 165–440 | 164–421 | 183–440 | 179–421 | €/m3 |
| Fibreboard | –0.54 | 337–428 | 362–411 | 362–403 | 377 | 383–386 | €/tonne |
| Plywood | –0.61 | 501–535 | 499 | 469–488 | 490 | 486–504 | €/m3 |
| Particle board | –0.51 | 233–271 | 247–260 | 246–263 | 258 | 248–259 | €/m3 |
| Newspaper | –0.04 | 459 | 480 | 457 | 490 | 504–506 | €/tonne |
| Printing and writing paper | –0.53 | 817–870 | 833–848 | 775–826 | 845 | 830–851 | €/tonne |
| Linerboard | –0.45 | 350–418 | 325–376 | 292–352 | 368 | 373–387 | €/tonne |
| Other paper and paper board | –0.45 | 762–837 | 739–803 | 737–775 | 811 | 764–788 | €/tonne |
| Table 4. Assumed cost for transporting roundwood between the different modelled regions. The transport cost is assumed independent of quantities, but varies with distance, based on a fixed terminal cost and a variable distance cost. The costs are based on the road, rail, or marine distances between the regional centres calculated in GIS and with official Norwegian road, rail, and harbour data provided by Kartverket (2022) and own estimated cost based on Grønland (2018). It is assumed that the model selects the least-cost transport method available between regions. | ||
| Distance dependent cost [€/km/m3] | Fixed terminal costs [€/m3] | |
| Road | 0.0457 | 1.43 |
| Rail | 0.0119 | 3.93 |
| Marin | 0.0037 | 4.22 |
| Table 5. The 17 included combination of numbers of plants and input sizes for the studied biofuel production. The different sizes of the production unit are 0.1 million m3, 0.5 million m3, and 1 million m3 input of biomass in each biofuel plant, in total forming these 8 different scenarios of biomass demand ranging from 0.1 million m3 to 5 million m3. | ||||||||
| Input capacity (million m3) | Number of biofuel plants | |||||||
| 0.1 | 1 | 2 | 5 | 10 | 20 | 30 | - | - |
| 0.5 | - | - | 1 | 2 | 4 | 6 | 8 | 10 |
| 1 | - | - | - | 1 | 2 | 3 | 4 | 5 |
| Total biomass demand in each scenario (million m3) | 0.1 | 0.2 | 0.5 | 1 | 2 | 3 | 4 | 5 |
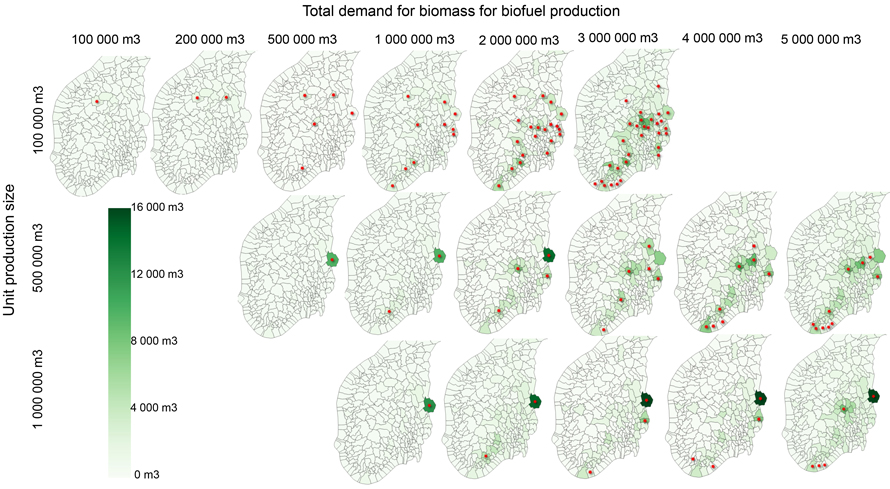
Fig. 3. Modelled location (red star) for biofuel plants using spruce or pine pulpwood. The different plant sizes are shown on different rows, while the different input of biomass is shown on different column. The colours represent changes in harvest from the base scenario without biofuel production in Norway. Light colours mean no change, while dark means an increased harvest of 16 000 m3. View larger in new window/tab.
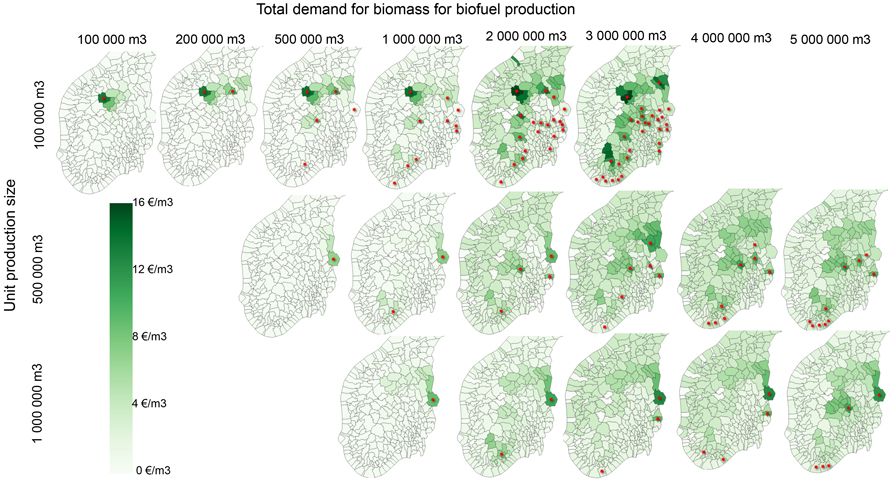
Fig. 4. Modelled change in pulpwood prices for the different scenarios and estimated location (red star) for biofuel plants using spruce or pine pulpwood. The different plant sizes are shown on different rows, while the different input of biomass is shown on different column. The colours represent changes in pulpwood prices from the base scenario without biofuel production in Norway. Light colours mean no change, while dark means an increased price of 16 €/m3. View larger in new window/tab.
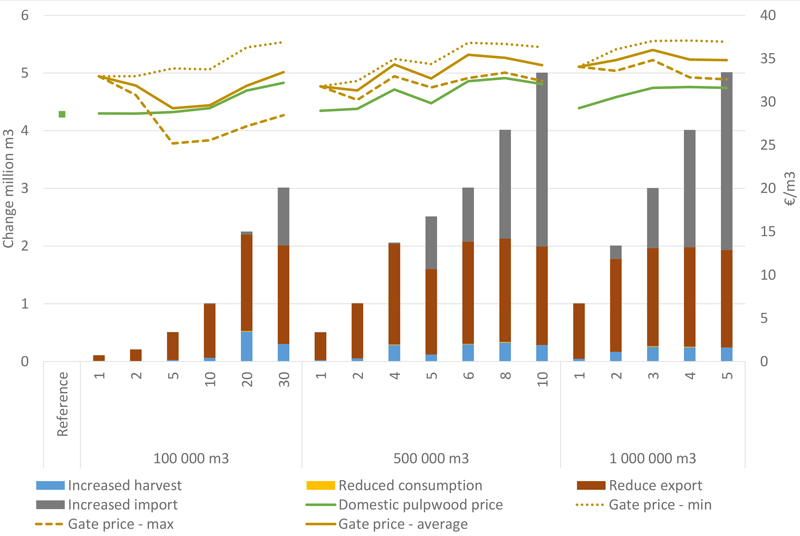
Fig. 5. Modelled biomass supply in Norway for different biofuel production scenarios with the use of pulpwood as raw material. The figure includes increased harvest, increased collection of harvest residues, reduced consumption in the existing industry, reduced export, and increased import of biomass (right axis), domestic pulpwood price, and the minimum, maximum, and average gate prices for the biofuel plant (right axis).
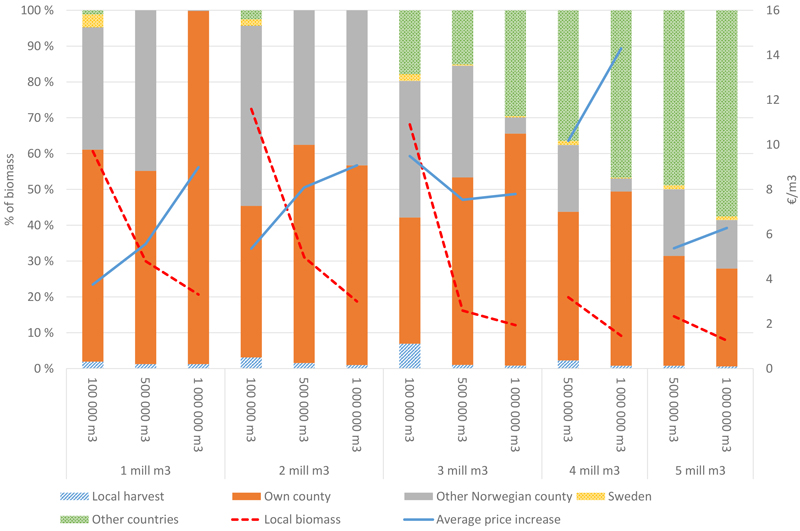
Fig. 6. Modelled proportion of the biomass that is sourced from own regions, own county, other counties in Norway, Sweden, and other countries (ROW) for the biofuel production, for the different unit sizes and total biomass demand scenarios, ranging from 1–5 million m3. The stippled line is the total biomass supplied from the local forest, defined as increased harvest and reduced export. The solid line is the increased average local price for pulpwood compared to the reference case without biofuel.
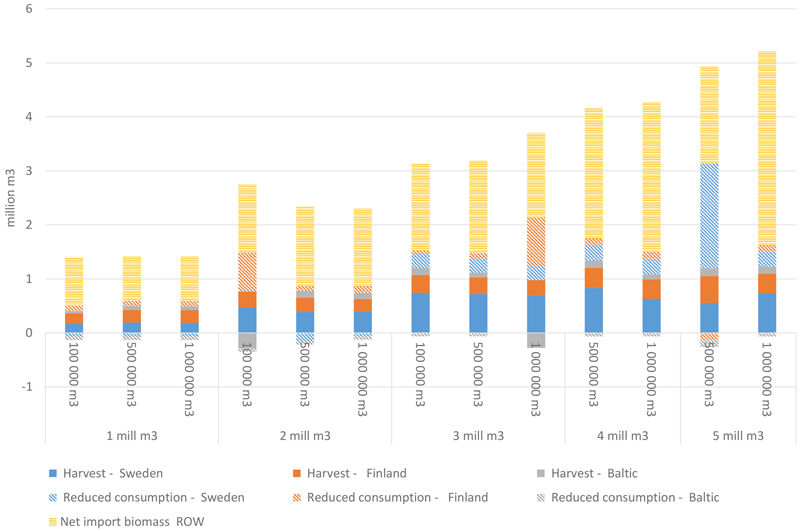
Fig. 7. Modelled effect of Norwegian biofuel production (x-axis) has on the other modelled countries. The figure includes harvest increase and change in industrial consumption (reduced consumption is a positive number) for pulpwood and by-products and net import of roundwood to a Nordic country from an import/export region for selected total biomass demand groups and biofuel production setups. The shown effects are mainly the indirect effect of change in net export as shown in Fig. 5.
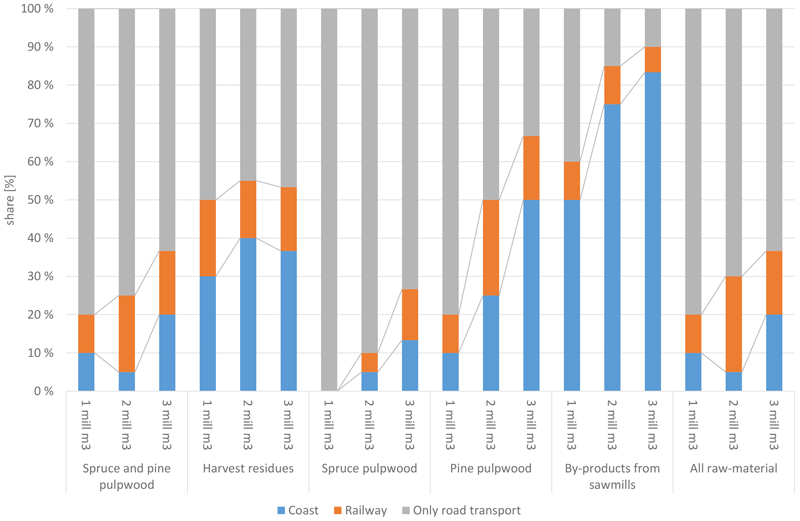
Fig. 8. Modelled optimal location for biofuel plants with input size of 100 000 m3 and total demand of 1–3 million m3 for the different scenarios. The blue bar represents the share of biofuel plant located in a municipality with a harbour, the orange bar is the share of biofuel plants that are located at a timber terminal along a railway and the grey bar represent locations that have eighter harbour or timber terminal within the same municipality.
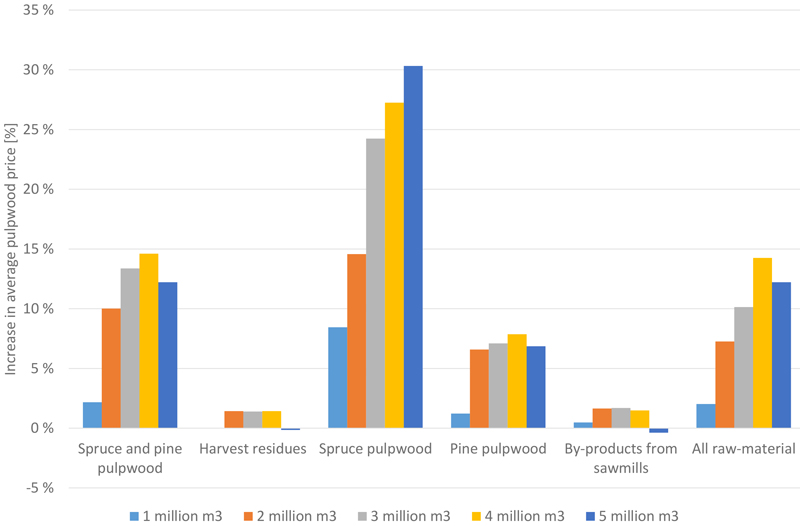
Fig. 9. Modelled increase in average pulpwood prices as a share of the reference pulpwood prices in Norway for the different scenarios, all scenarios are based on unit production size 500 000 m3. The scenario “Spruce and pine pulpwood” is the base scenario and allows the production of biofuel from spruce and pine pulpwood only, “Harvest residues” allow biofuel production from harvest residues, “Spruce pulpwood” allow biofuel production from spruce pulpwood, “Pine pulpwood” allow biofuel production from pine pulpwood, “By-products from sawmills” allow biofuel production from by-products from sawmilling, and finally, “All raw-materials” allow biofuel production from spruce, pine, and non-coniferous pulpwood, harvest residues, and by-products from sawn mills.