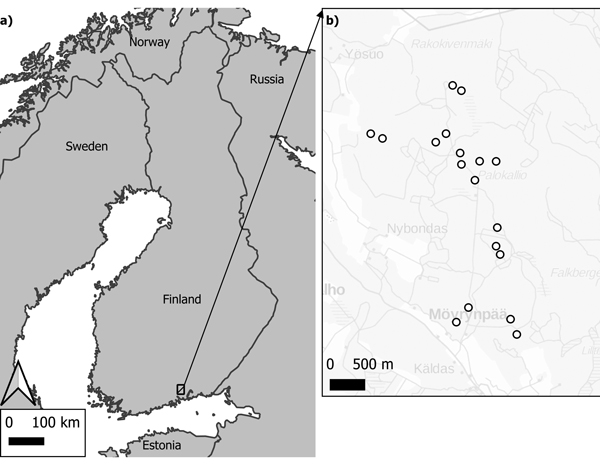
Fig. 1. Study area of Lapinjärvi research forest, located in southern Finland. Map derived for countries 1:1 M (a)/© QGIS; Back-ground map for sample plot area of interest 1:1 M (b)/© National Land Survey of Finland/ WMS open data licensed under a CC 4.0 license.
| Table 1. Quantity of measured sample trees by measurement instrument, measured variable, observer, and tree species. Measured variables are diameter at breast height (dbh) and upper stem diameter (d6). | |||||||
| Instrument | Sonar | Criterion | Calliper | ||||
| Variable | dbh | dbh | d6 | d6 | |||
| Observer | 1 or 2 | 1 | 2 | 1 | 2 | 1 | 2 |
| Scots pine | 112 | 108 | 107 | 108 | 107 | 59 | 49 |
| Norway spruce | 142 | 130 | 101 | 130 | 101 | 52 | 78 |
| Birch | 64 | 61 | 35 | 61 | 35 | 25 | 35 |
| Aspen | 4 | 4 | 4 | 4 | 4 | 3 | 1 |
| Grey alder | 4 | 3 | 3 | 3 | 3 | 1 | 2 |
| Sample trees total | 326 | 306 | 250 | 306 | 250 | 140 | 165 |
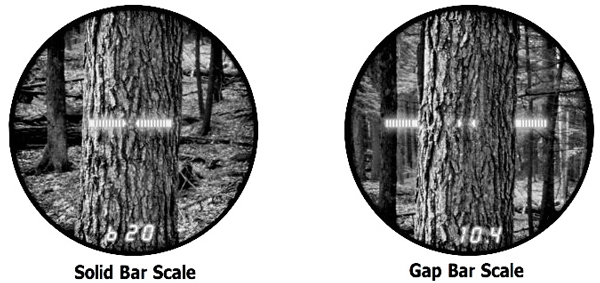
Fig. 2. Criterion RD 1000 instrument setup options for the diameter measurement bars (Laser Technology 2006).
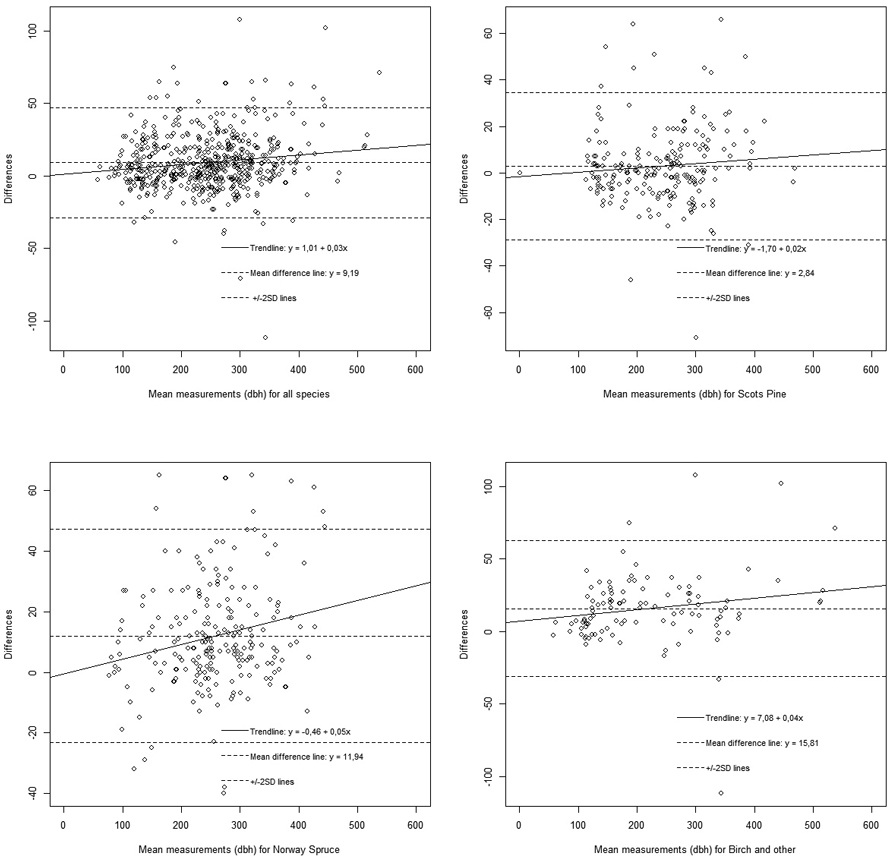
Fig. 3. Bland-Altman plots for diameter at breast height (dbh) to visualise the standard deviation of the differences. Differences between measurement instruments are compared to the mean value of all measurements and are visualised for the different tree species. View larger in new window/tab.
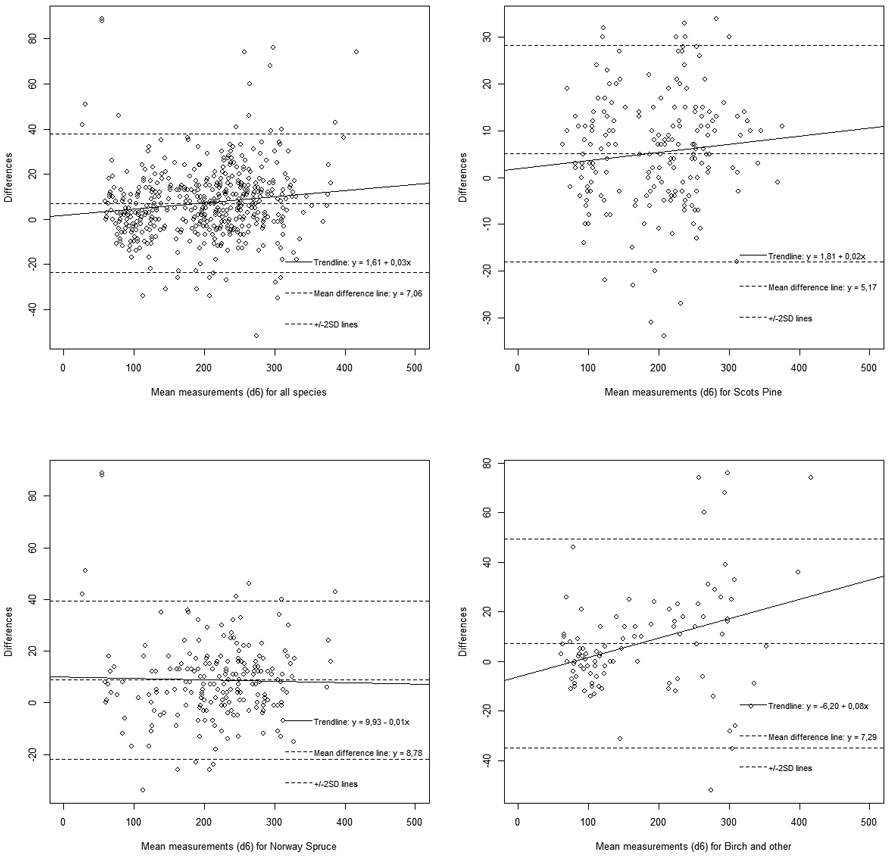
Fig. 4. Bland-Altman plots for upper stem diameter (d6) to visualise the standard deviation of the differences. Differences between measurement instruments are compared to the mean value of all measurements and are visualised for the different tree species. View larger in new window/tab.
| Table 2. Standard deviation for diameter at breast height (dbh) and upper stem diameter (d6) for Criterion with reference to earlier research with a steel calliper. Number of paired observations is n, maximum standard deviation for Criterion is Supper, referenced standard deviation for Calliper is Sref and Criterion standard deviation is SCRI. Measurement unit is shown in millimetres. | ||||||
| Species | variable | n | n (outliers) | Supper | Sref | SCRI |
| All | dbh | 553 | 3 | 19.96 | 6.90 | 18.73 |
| Scots pine | dbh | 215 | 0 | 16.40 | 6.90 | 14.87 |
| Norway spruce | dbh | 231 | 0 | 21.50 | 6.90 | 20.36 |
| Birch and other | dbh | 107 | 3 | 22.82 | 6.90 | 21.75 |
| All | d6 | 519 | 4 | 16.88 | 7.00 | 15.36 |
| Scots pine | d6 | 205 | 0 | 11.39 | 6.00 | 9.68 |
| Norway spruce | d6 | 214 | 0 | 16.51 | 7.00 | 14.95 |
| Birch and other | d6 | 100 | 4 | 20.05 | 7.00 | 18.79 |
| Table 3. Standard deviation and bias for Criterion with reference to the mean measurement value. Diameter at breast height is dbh, upper stem diameter d6, number of paired observations is n, standard deviation is SCRI and measurement unit is shown in millimetres. | ||||||
| Species | variable | n | SCRI | SCRI (%) | bias | bias (%) |
| All | dbh | 556 | 12.21 | 4.99 | –3.31 | –1.35 |
| Scots pine | dbh | 215 | 10.67 | 4.40 | –0.96 | –0.40 |
| Norway spruce | dbh | 231 | 12.29 | 4.76 | –4.11 | –1.59 |
| Birch and other | dbh | 110 | 14.64 | 6.62 | –6.20 | –2.81 |
| All | d6 | 519 | 8.88 | 4.47 | –2.44 | –1.23 |
| Scots pine | d6 | 205 | 7.73 | 4.01 | –1.73 | –0.90 |
| Norway spruce | d6 | 214 | 9.45 | 4.33 | –3.27 | –1.50 |
| Birch and other | d6 | 100 | 9.78 | 5.79 | –2.12 | –1.25 |
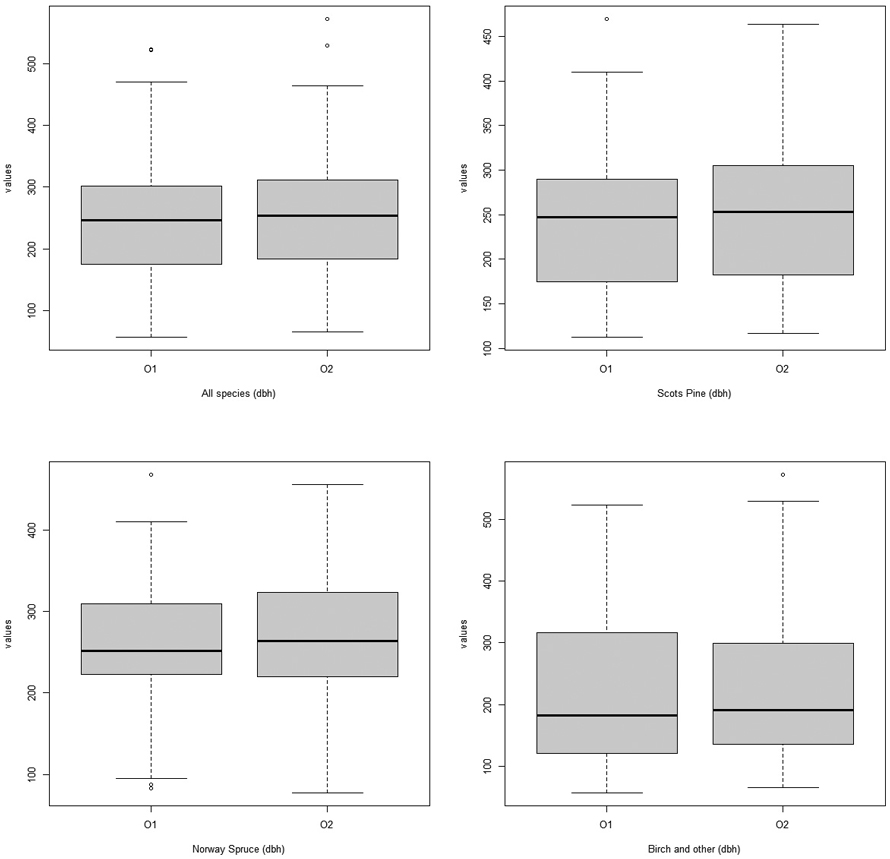
Fig. 5. Boxplots visualizing the data distribution of diameter at breast height (dbh) measurements and for different tree species. O1 = Observer 1 and O2 = Observer 2. View larger in new window/tab.
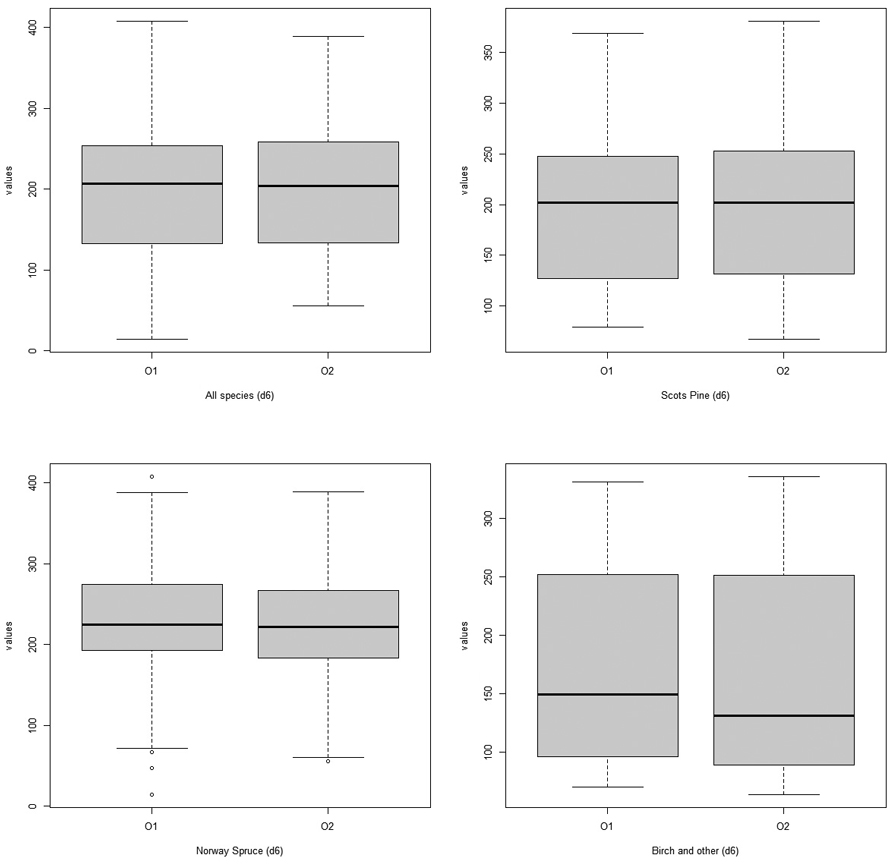
Fig. 6. Boxplots visualising the data distribution for the upper stem diameter (d6) measurements and for different species. O1 = Observer 1 and O2 = Observer 2. View larger in new window/tab.