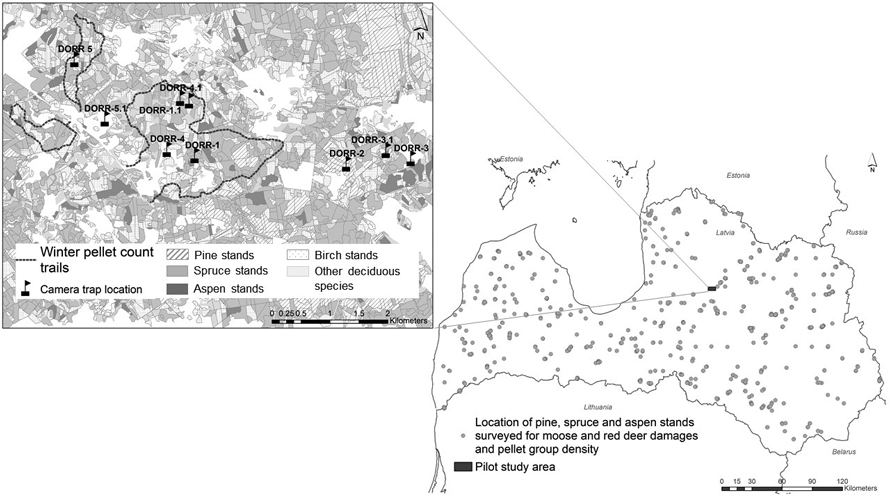
Fig. 1. Location of pine, spruce and aspen stands for ungulate damage surveys and pellet counts during 2017–2021 (picture on the right side). On the left side – the map of pilot territory located in central part of Latvia: transects of winter pellet group counts and location of trail camera. During the study, one camera (Dorr2) was permanently installed for detecting the passing animals while the location of four was changed to different positions to monitor animal activity in different parts of the study area. View larger in new window/tab.
| Table 1. Values (mean ± standard error (±SE), median and maximal (Max) values) of moose and red deer pellet group densities per 100 m2 sample plots in pine (n = 756), spruce (n = 664) and aspen (n = 620) stands in Latvia during 5-year period (2017–2021) of survey. (M – males; F – females; J – juveniles) | ||||||||||
| Pine stands | Spruce stands | Aspen stands | ||||||||
| Mean ± SE | Med | Max | Mean ± SE | Med | Max | Mean ± SE | Med | Max | ||
| Moose Total | 0.74 ± 0.04 | 0.33 | 10.06 | 0.33 ± 0.02 | 0.11 | 5.25 | 0.60 ± 0.03 | 0.28 | 10.75 | |
| Moose M | 0.26 ± 0.02 | 0 | 5.41 | 0.11 ± 0.0 | 0 | 2.5 | 0.22 ± 0.02 | 0.22 | 3 | |
| Moose F | 0.32 ± 0.02 | 0.07 | 3.75 | 0.15 ± 0.01 | 0 | 4.75 | 0.26 ± 0.02 | 0.22 | 10 | |
| Moose F + J | 0.44 ± 0.03 | 0.17 | 7.00 | 0.19 ± 0.02 | 0 | 4.75 | 0.36 ± 0.03 | 0.25 | 10 | |
| Red deer Total | 0.69 ± 0.04 | 0.28 | 7.86 | 0.64 ± 0.04 | 0.28 | 7.25 | 0.43 ± 0.03 | 0.22 | 9.25 | |
| Red deer M | 0.21 ± 0.01 | 0 | 3.88 | 0.18 ± 0.01 | 0 | 2.81 | 0.15 ± 0.01 | 0 | 2.75 | |
| Red deer F | 0.25 ± 0.02 | 0 | 5.38 | 0.22 ± 0.02 | 0 | 5.75 | 0.15 ± 0.02 | 0 | 6 | |
| Red deer F + J | 0.43 ± 0.03 | 0.1 | 7.25 | 0.38 ± 0.027 | 0.13 | 6.25 | 0.23 ± 0.023 | 0 | 6.75 | |
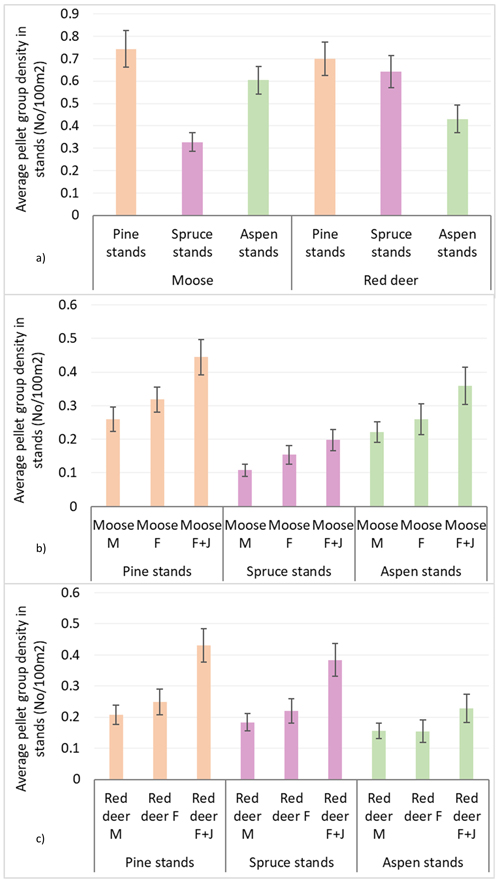
Fig. 2. Moose and red deer pellet group densities (pellet group number per 100 m2) in all pine, spruce and aspen stands in Latvia in 5-year period (2017–2021): (a) moose and red deer in total, (b) moose in sex-age classes, (c) red deer in sex-age classes. M – male; F – female; J – juvenile (mean values ± confidence interval).
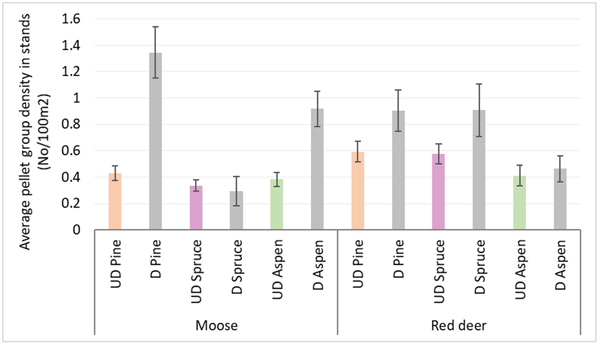
Fig. 3. Moose and red deer pellet group densities in undamaged and damaged pine, spruce and aspen stands in Latvia in 5-year period (2017–2021). UD – undamaged stands, D – damaged stands. (Mean values ± confidence interval).
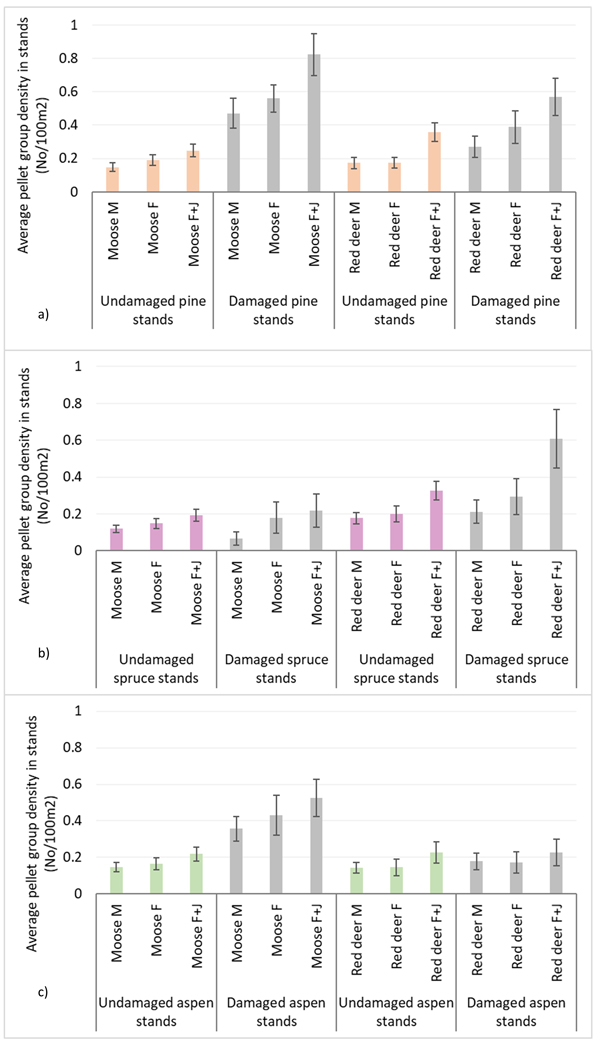
Fig. 4. Moose and red deer pellet group densities of all animals and their sex-age groups in undamaged and damaged pine (a), spruce (b) andaspen (c) stands in Latvia in 5-year period (2017–2021). M – male; F – female; J – juvenile; UD – undamaged stands, D – damaged stands. (Mean values ± confidence interval).
| Table 2. Damaged tree proportion change predictions in pine, spruce and aspen stands by using deer density indices. Test results of Generalized Linear model (significant differences are bolded). | ||||||||
| Parameter | B | Std. Error | 95% Wald Confidence Interval | Hypothesis Test | ||||
| Lower | Upper | Wald Chi-Square | df | Sig. | ||||
| Pine stands | (Intercept) | 6.024 | 0.6915 | 4.669 | 7.379 | 75.886 | 1 | 0.000 |
| Moose M | 5.176 | 1.2233 | 2.779 | 7.574 | 17.906 | 1 | 0.000 | |
| Moose F | 7.999 | 1.1916 | 5.663 | 10.334 | 45.060 | 1 | 0.000 | |
| Red deer M | 2.613 | 1.4217 | –0.173 | 5.400 | 3.379 | 1 | 0.066 | |
| Red deer F | 1.963 | 1.0878 | –0.169 | 4.095 | 3.258 | 1 | 0.071 | |
| (Scale) | 213 564 a | 10.9845 | 193.084 | 236.216 | ||||
| Spruce stands | (Intercept) | 1.215 | 0.2168 | 0.790 | 1.640 | 31.391 | 1 | 0.000 |
| Moose M | –1.534 | 0.7072 | –2.920 | –0.148 | 4.703 | 1 | 0.030 | |
| Moose F | 0.549 | 0.4767 | –0.385 | 1.484 | 1.328 | 1 | 0.249 | |
| Red deer M | 0.235 | 0.5547 | –0.852 | 1.322 | 0.179 | 1 | 0.672 | |
| Red deer F | 0.378 | 0.3933 | –0.393 | 1.149 | 0.924 | 1 | 0.336 | |
| (Scale) | 19 133 a | 1.0501 | 17.182 | 21.306 | ||||
| Aspen stands | (Intercept) | 7.027 | 1.0665 | 4.937 | 9.117 | 43.417 | 1 | 0.000 |
| Moose M | 20.140 | 2.1302 | 15.964 | 24.315 | 89.383 | 1 | 0.000 | |
| Moose F | 8.033 | 1.4192 | 5.251 | 10.814 | 32.034 | 1 | 0.000 | |
| Red deer M | 7.710 | 2.9278 | 1.971 | 13.448 | 6.934 | 1 | 0.008 | |
| Red deer F | –1.356 | 2.0084 | –5.292 | 2.581 | 0.456 | 1 | 0.500 | |
| (Scale) | 396 235 a | 22.5046 | 354.493 | 442.891 | ||||
| Dependent Variable: Damaged tree proportion in stand. Model: (Intercept), Moose M, Moose F, Red deer M, Red deer F. a: Maximum likelihood estimate. | ||||||||
| Table 3. Values (mean ± standard error SE) of moose and red deer pellet group count results in pilot study area in central part of Latvia (Mean ± standard error SE) and total No of pellet groups counted (N) in these transects. (M – males; F – females; J – juveniles). | ||||||
| 2019 | 2020 | 2021 | ||||
| Mean ± SE | N | Mean ± SE | N | Mean* | N | |
| Moose Total | 0.21 ± 0.04 | 62 | 0.27 ± 0.04 | 85 | 0.35 | 111 |
| Moose M | 0.09 ± 0.02 | 27 | 0.08 ± 0.02 | 27 | 0.07 | 23 |
| Moose F | 0.08 ± 0.02 | 25 | 0.12 ± 0.02 | 39 | 0.17 | 55 |
| Moose F + J | 0.12 ± 0.02 | 10 | 0.18 ± 0.03 | 19 | 0.10 | 33 |
| Red deer Total | 1.27 ± 0.09 | 372 | 1.39 ± 0.11 | 442 | 2.10 | 664 |
| Red deer M | 0.17 ± 0.03 | 49 | 0.24 ± 0.04 | 77 | 0.42 | 134 |
| Red deer F | 0.75 ± 0.06 | 220 | 0.89 ± 0.07 | 285 | 1.23 | 388 |
| Red deer F + J | 0.35 ± 0.04 | 103 | 1.15 ± 0.09 | 80 | 0.45 | 142 |
| * Due to technical failures (missing pattern of value distribution in 2021), it was not possible to calculate the standard error for these values for year 2021. | ||||||
| Table 4. Mean values of maximal animal numbers per 30-minute events in considered seasons (spring, summer/autumn) depending on trail camera placement in pilot study area – with or without attractants (in spring all cameras were located near attractants.). Sum – sum of maximal numbers of animal per 30-minute events. | ||||||||
| Spring | Summer Total | Summer with attractant | Summer without attractant | |||||
| Mean | Sum | Mean | Sum | Mean | Sum | Mean | Sum | |
| Moose Total | 1.31 ± 0.10 | 36 | 1.23 ± 0.04 | 100 | 1.31 ± 0.06 | 65 | 1.12 ± 0.05 | 35 |
| Moose M | 0.34 ± 0.08 | 11 | 0.401 ± 0.05 | 35 | 0.40 ± 0.07 | 21 | 0.41 ± 0.08 | 14 |
| Moose F | 0.59 ± 0.09 | 19 | 0.56 ± 0.05 | 48 | 0.52 ± 0.07 | 27 | 0.62 ± 0.08 | 21 |
| Moose F + J | 0.78 ± 0.15 | 25 | 0.75 ± 0.08 | 65 | 0.84 ± 0.11 | 44 | 0.62 ± 0.08 | 21 |
| Red deer Total | 1.05 ± 0.08 | 678 | 1.26 ± 0.07 | 810 | 1.33 ± 0.09 | 499 | 0.82 ± 0.06 | 311 |
| Red deer M | 1.30 ± 0.06 | 108 | 1.12 ± 0.03 | 135 | 1.23 ± 0.07 | 47 | 1.07 ± 0.03 | 88 |
| Red deer F | 2.59 ± 0.13 | 478 | 1.64 ± 0.06 | 465 | 1.75 ± 0.08 | 304 | 1.45 ± 0.09 | 161 |
| Red deer F + J | 0.88 ± 0.07 | 570 | 1.05 ± 0.08 | 675 | 1.20 ± 0.09 | 452 | 0.59 ± 0.06 | 223 |
| Table 5. χ2 test results of F and M proportions in moose and red deer between camera data in different seasons/placements and pellet group count results (insignificant differences are bolded). | |||
| Model | Sex ratio F:M | χ2 value | P |
| moose CAMERA SPRING vs. moose PELLETS 2020 | 1:0.58 vs. 1:0.47 | 0.241 | 0.624 |
| moose CAMERA SUMMER vs. moose PELLETS 2021 | 1:0.73 vs. 1:0.26 | 10.423 | 0.001 |
| moose CAMERA SUMMER with attractants vs. moose PELLETS 2021 | 1:0.78 vs. 1:0.26 | 8.879 | 0.003 |
| moose CAMERASUMMER without attractants vs. moose PELLETS 2021 | 1:0.67 vs. 1:0.26 | 5.223 | 0.022 |
| Red deer CAMERA SPRING vs. red deer PELLETS 2020 | 1:0.25 vs. 1:0.21 | 0.899 | 0.342 |
| Red deer CAMERA SUMMER vs. red deer PELLETS 2021 | 1:0.27 vs. 1:0.31 | 1.202 | 0.273 |
| Red deer CAMERA SUMMER with attractants vs. red deer PELLETS 2021 | 1:0.28 vs. 1:0.31 | 0.631 | 0.427 |
| Red deer CAMERA SUMMER without attractants vs. red deer PELLETS 2021 | 1:0.24 vs. 1:0.31 | 1.361 | 0.243 |