| Table 1. Descriptive statistics of the respondents of a survey exploring attitudes towards wooden multi-storey building (WMSB) in seven European countries. Populations Eurostat (2023). | ||||||||
| Austria | Denmark | Finland | Germany | Norway | Sweden | United Kingdom | All | |
| Population | ||||||||
| n (million) | 9.1 | 5.9 | 5.6 | 84.4 | 5.5 | 10.5 | 67* | 188 |
| Survey respondents | ||||||||
| n | 1000 | 1000 | 1000 | 1001 | 1001 | 1003 | 1002 | 7007 |
| Average age | 46.6 | 48.4 | 48.4 | 48.9 | 47.2 | 48.4 | 46.9 | 47.9 |
| Respondents gender | ||||||||
| Male | 48% | 49% | 49% | 49% | 50% | 49% | 49% | 49% |
| Female | 52% | 51% | 51% | 51% | 50% | 51% | 51% | 51% |
| Size of population in area where respondents live | ||||||||
| >1 000 000 | 23% | 22% | 22% | 16% | 13% | 21% | 15% | 19% |
| 100 000–1 000 000 | 13% | 18% | 27% | 24% | 22% | 26% | 23% | 22% |
| 10 000–100 000 | 23% | 33% | 32% | 33% | 29% | 29% | 38% | 31% |
| Village < 10 000 | 26% | 18% | 9% | 18% | 20% | 13% | 20% | 18% |
| Countryside | 16% | 9% | 10% | 8% | 16% | 11% | 4% | 11% |
| Children in household (under 18 years) | ||||||||
| None | 73% | 75% | 81% | 74% | 70% | 74% | 71% | 74% |
| 1 child | 14% | 12% | 10% | 14% | 14% | 11% | 14% | 13% |
| 2 children or more | 13% | 13% | 9% | 12% | 16% | 15% | 15% | 13% |
| Experience of WMSB | ||||||||
| Visited WMSBs built in the 2000’s | 3.6% | 2.9% | 6.6% | 1.5% | 7.8% | 7.0% | 3.7% | 4.7% |
| Lived in WMSBs built in the 2000’s | 0.9% | 1.8% | 1.0% | 1.3% | 5.1% | 1.9% | 1.1% | 1.9% |
| * Population in 2020. Newer data for United Kingdom was not available through Eurostat. | ||||||||
| Table 2. Background variables and variable types utilized in this study. | |
| Variable | Variable type |
| Attractiveness of WMSBs | Likert scale: 1 = not attractive, 9 = very attractive (10 = I don’t know) |
| Country | Choice (categorical): Denmark; Finland; Norway; Sweden; Germany; UK; Austria |
| Region | Choice (categorical): Type of living environment: the capital region or a metropolitan area (> 1 million inhabitants); in a large city (100 000–1 000 000 inhabitants); in a small or medium sized city (10 000–100 000 inhabitants); in a village (<10 000 inhabitants); in the countryside |
| Age | Numerical, range 18–99. Divided into two groups, “young” (<35 years) and “older” (35+ years) |
| Home ownership type | Choice (categorical): Owning, renting, other |
| Type of housing | Choice (categorical): Detached, single-family house; semi-detached house; townhouse/row house; apartment-building (1–2 stories (floors)); apartment in a multi-storey building (minimum 3 stories (floors)); other |
| Forest-related job | Choice (yes/no): Have you ever had, a job (work) connected to the forest-based, the building or the real estate sector? |
| Building and real estate related job | Choice (yes/no): Have you ever had, a job (work) connected to the forest-based, the building or the real estate sector? |
| Table 3. List of variables and their expected impact on the attractiveness of wooden multi-storey building (WMSB) (adapted from Roos et al. 2023). | |
| Variable | H0 and rationale |
| Attractiveness of WMSB | Dependent variable |
| Country: Existing wood construction culture | + The relative extent of wood resources increases the likelihood of a country to favor wood in construction, increasing familiarity (Hurmekoski 2016; Ranacher et al. 2020) |
| Region: Rural | + Less urban surroundings may mean more direct relationship with forests and sustainable resource extraction, as well as increased familiarity towards wood construction (Lindkvist et al. 2012; Hemström et al. 2014; Kylkilahti et al. 2020) |
| Age | +/– Generally, younger consumers are more environmentally conscious and support wood construction (Toppinen et al. 2018), although the impact could also be non-linear, peaking in the middle age (Fisher et al. 2012; Ranacher et al. 2020) |
| Home ownership type: Rental | + Less risk when not owning an apartment |
| Type of housing: Detached | +/– Detached houses are more likely to be built of wood, which increases familiarity (Kylkilahti et al. 2020). However, some residents currently living in a detached house may dislike apartments in multi-storey buildings regardless of material, decreasing the attractiveness of WMSB. |
| Forest-related job: Yes | + Increases familiarity |
| Building and real estate related job: Yes | + Increases familiarity |
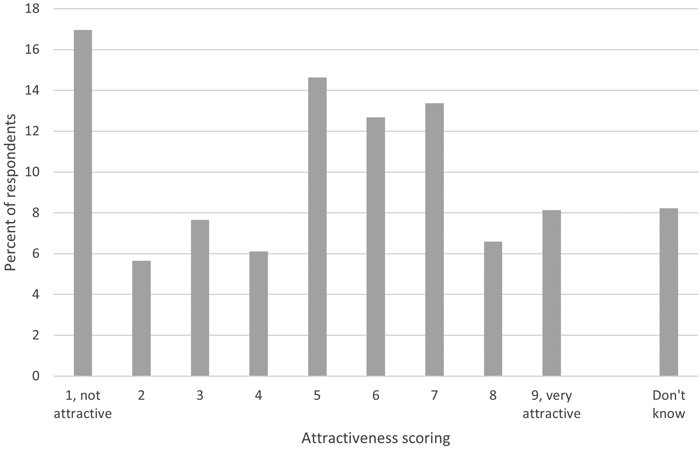
Fig. 1. Overall attractiveness scoring of wooden multi-storey buildings (WMSBs) among all respondents (n = 7007), 1 = not attractive, 9 = very attractive.
| Table 4. Consumer segments identified in this study and their proportion of all respondents. | ||||
| Segment name | Sub-segment name | Segment characteristics | n | % of all respondents |
| Young urbans | Young (under 35 years) consumers living in a big city or metropolitan area | 939 | 13% | |
| Young urbans | Young urban detached | Young urban consumers living in a detached house | 115 | 2% |
| Young urbans | Young urban MSB | Young urban consumers living in a multi-storey building | 484 | 7% |
| Young urbans | Young urban professionals | Young urban consumers with a job related to forest sector or construction | 128 | 2% |
| Older urbans | Older (35 years and above) consumers living in a big city or metropolitan area | 1919 | 27% | |
| Older urbans | Older urban detached | Older urban consumers living in a detached house | 356 | 5% |
| Older urban | Older urban MSB | Older urban consumers living in a multi-storey building | 869 | 12% |
| Older urban | Older urban homeowners | Older urban consumers owning a home | 1118 | 16% |
| Young rurals | Young (under 35 years) consumers living in a village or countryside | 406 | 6% | |
| Young rurals | Young rural detached | Young rural consumers living in a detached house | 198 | 3% |
| Young rurals | Young rural MSB | Young rural consumers living in a multi-storey building | 37 | 1% |
| Older rurals | Older (35 years and above) consumers living in a village or countryside | 1569 | 22% | |
| Older rurals | Older rural detached | Older rural consumers living in a detached house | 999 | 14% |
| Older rurals | Older rural MSB | Older rural consumers living in a multi-storey building | 110 | 2% |
| Older rurals | Older rural homeowners | Older rural consumers owning a home | 1209 | 17% |
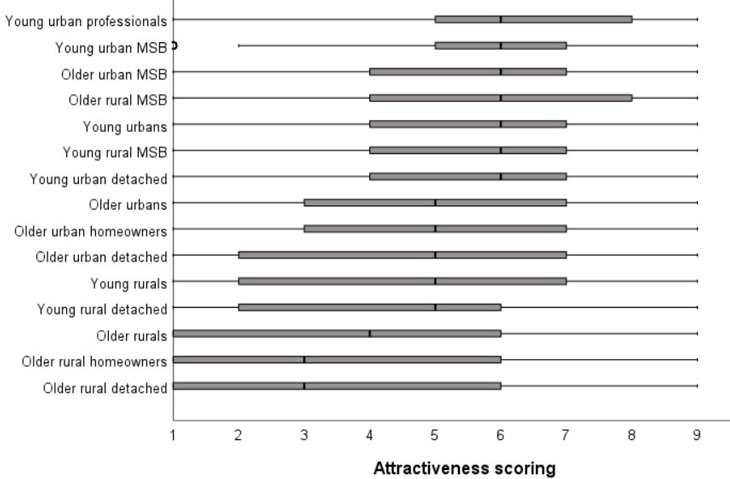
Fig. 2. Box and whisker plot visualizing the attractiveness scoring of WMSBs by consumer segments, 1 = not attractive, 9 = very attractive. The vertical lines inside the boxes indicate the median value. The left boundary of the box is the 1st quartile, Q1 and the right boundary the 3rd quartile, Q3. The length of the box is the interquartile range, IQR. Whiskers represent the minimum (on the left) and maximum (on the right) values above Q1–1.5×IQR and below Q3+1.5×IQR.
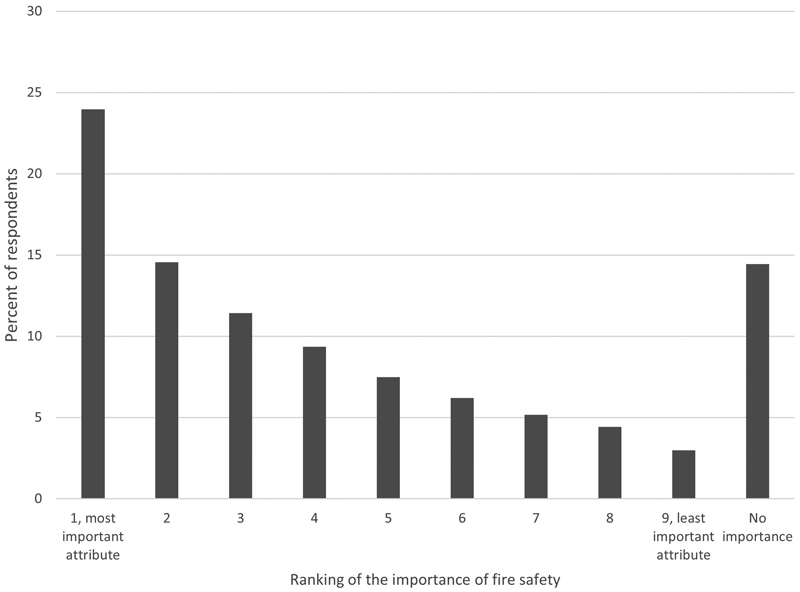
Fig. 3. The importance of fire safety when determining the attractiveness of WMSBs as ranked by all respondents (1 = the most important attribute, 9 = the least important attribute; 0 = attribute of no importance).
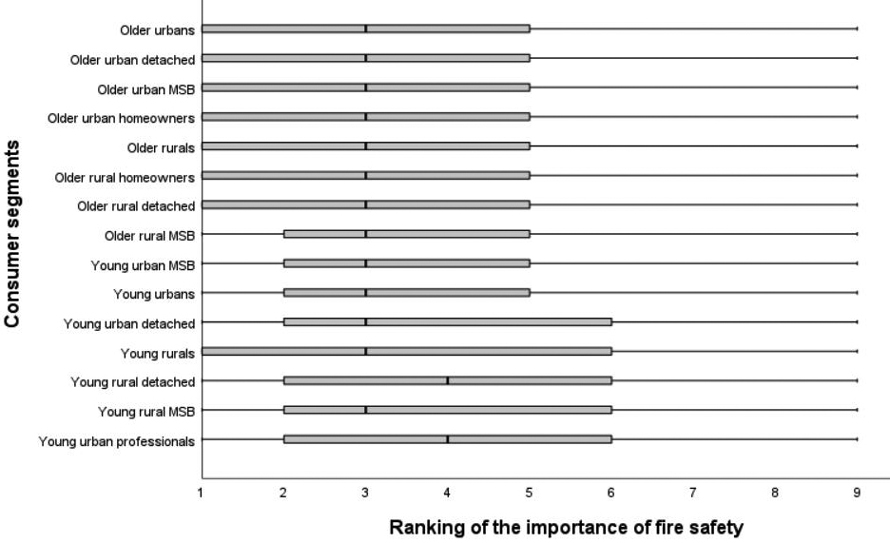
Fig. 4. Box and whisker plot visualizing the importance of fire safety when determining the attractiveness of WMSBs by consumer segments. The left boundary of the box is the 1st quartile, Q1 and the right boundary the 3rd quartile, Q3. The length of the box is the interquartile range, IQR. Whiskers represent the minimum (on the left) and maximum (on the right) values above Q1–1.5×IQR and below Q3+1.5×IQR.
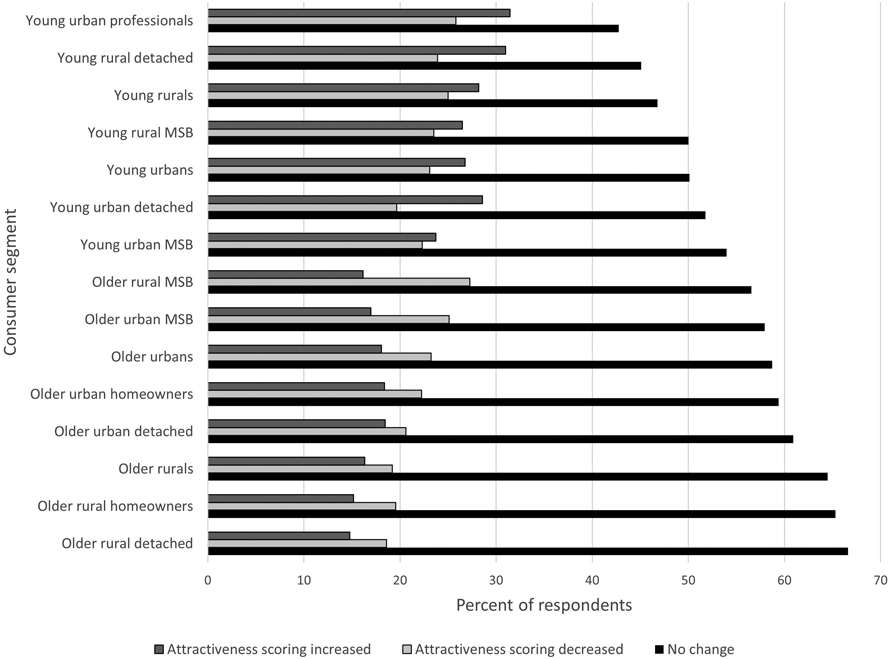
Fig. 5. Changes in the scoring of the attractiveness of WMSBs after receiving information on fire safety, organized by consumer segments. Dark grey bar indicates that the attractiveness scoring of WMSBs increased after receiving information, light grey indicates the attractiveness scoring decreased after receiving information, and black bar indicates there was no change in the attractiveness scoring of WMSBs.
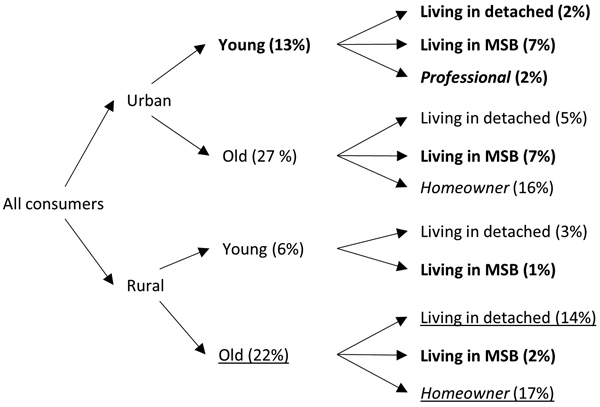
Fig. 6. Consumer segments identified in the study. The percentages refer to the proportion of all respondents. The segments in Italics overlap with the other sub-segments. Bolded font indicates the segments that scored the attractiveness of WMSBs on average highest, while underlined font indicates the segments that scored the attractiveness of WMSB on average lowest.