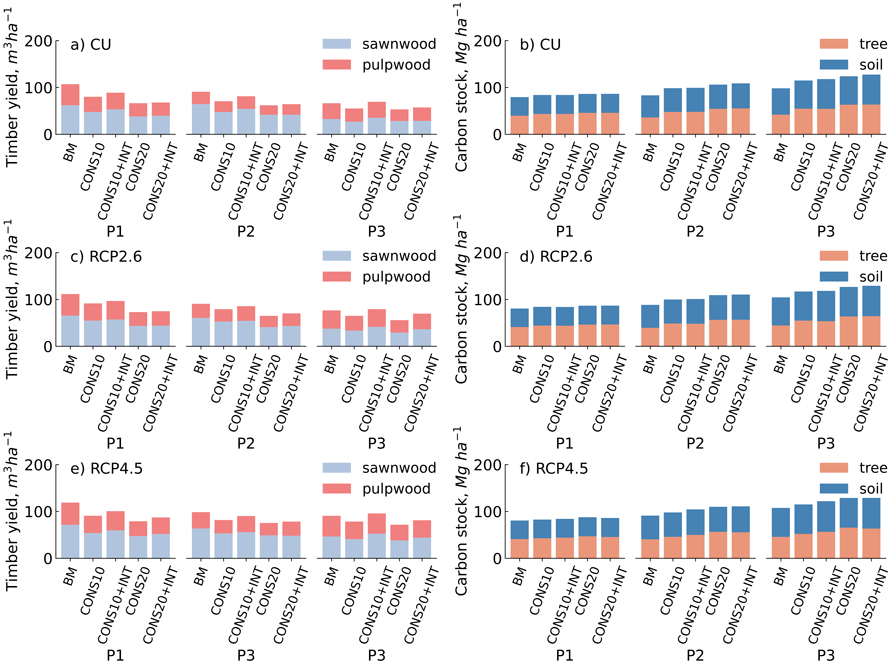
Fig. 1. The total timber yield (m3 ha–1) (a,c,e) and ecosystem carbon stock (Mg ha–1) (b,d,f) over three 30-year periods (P1,P2,P3) for different management scenarios under the current climate (CU), Representative Concentration Pathway RCP2.6 and RCP4.5 climate change projections in eastern Finland.
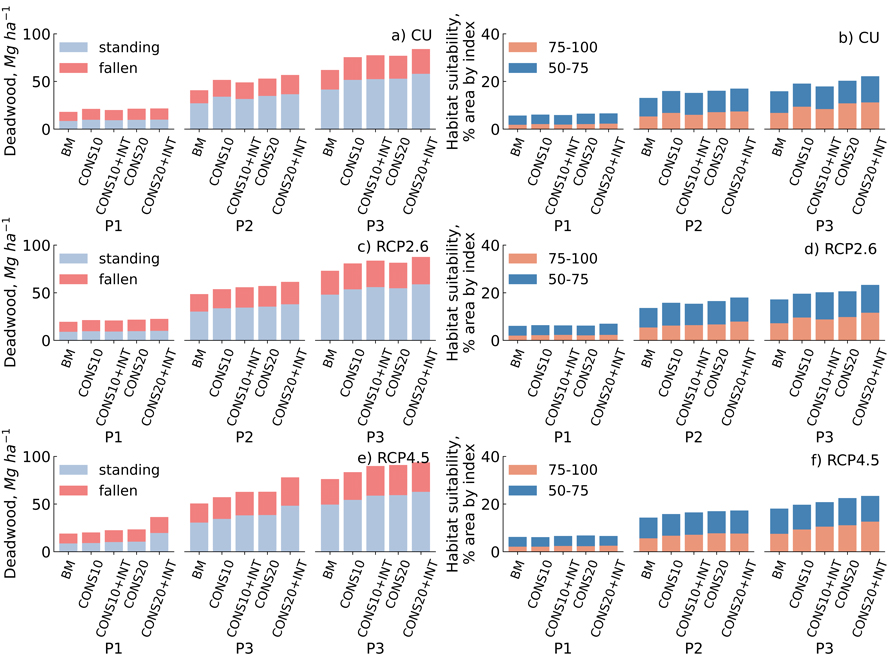
Fig. 2. The total amount of dead wood (Mg ha–1) (a,c,e) and suitable habitat area for saproxylic species (%) (b,d,f) over three 30-year simulation period (P1,P2,P3) for different management scenarios under the current climate (CU), RCP2.6 and RCP4.5 climate change projections in central Finland. (50–75) Means that the habitat is suitable and (75–100) means that the habitat is very suitable for the species.