| Table 1. Description and rationale of the four analysed conservation measures. | |
| Conservation measure | Description |
| Green tree retention (GTR) | This conservation measure aims to ‘lifeboat’ species over the regeneration phase after harvest, and to mimic natural disturbances such as storm felling, fire and insect outbreak (Vanha-Majamaa and Jalonen 2001; Gustafsson et al. 2010). By retaining a number of live trees (“green”) after harvest, this measure secures habitats for old tree-dependent species and connectivity (Gustafsson et al. 2012; Lindenmayer et al. 2012). Retention is a term used on a variety of measures to retain some pre-harvest forest structures after harvest (Fedrowitz et al. 2014). Often, 10 trees ha–1 are left in groups or as single trees (Vanha-Majamaa and Jalonen 2001; Gustafsson et al. 2020). |
| Patch retention (PR) | Forest patches with green trees are left after harvest, with the aim to maintain landscape-level biodiversity (Lindenmayer et al. 2012). The definition and use of PR differ greatly between countries (Timonen et al. 2010; Hakkila et al. 2019), varying in size, biological value and administration. |
| Dead wood retention (DW) | Dead wood can be constructed artificially as high stumps, cut-logs or retention of any dead wood present before logging. The aim is to provide substrate for saproxylic species after harvest (Juutilainen et al. 2011; Lassauce et al. 2011; Seibold et al. 2015; Hekkala et al. 2016). Dead wood is especially important for many threatened forest species (Nieto and Alexander 2010). |
| Riparian buffer zone (RB) | A forested zone along watersheds is retained after harvest and aims at sustaining the important ecotone between a water body and the upland forest (Gundersen et al. 2010; Kuglerová et al. 2014). The riparian zone holds different kinds of species than the upland forest and contributes to regional increase in species richness (Sabo et al. 2005). The width of the buffer affects its ability to sustain the riparian buffer’ ecological function (Kuglerová et al. 2014). |
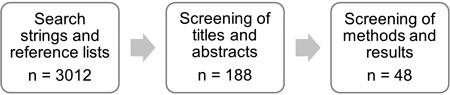
Fig. 1. The chart shows the workflow of the process of literature review of the effectiveness of four conservation measures conducted upon harvest. Number of articles (n) retained in each round is shown under each step in the process.
| Table 2. Definition of no-harvest control sub-groups based on origin and management status, with number of articles and observations per sub-group. | |||
| Sub-groups | Definition | Number of articles | Number of observations |
| Mature, unmanaged forest | Mature forest regenerated after natural disturbance e.g. wind, fire, or pests (Kuuluvainen and Gauthier 2018) | 25 | 140 |
| Mature, managed forest | Mature forest regenerated after silvicultural practice e.g. selective logging or clear-cutting, regenerated naturally or by planting (Chazdon et al. 2016) | 21 | 38 |
| Table 3. Number of articles and observations obtained for the review per conservation measure. The sum of articles is greater than 48, because some articles covers more than one conservation measure. | |||
| Conservation measure | Number of articles after screening titles and abstract (n = 188) | Number of articles after screening methods and result section (n = 48) | Number of observations (n = 238) |
| Green tree retention (GTR) | 71 | 26 | 157 |
| Patch retention (PR) | 20 | 6 | 32 |
| Dead wood enhancement (DW) | 65 | 8 | 23 |
| Riparian buffer zone (RB) | 32 | 9 | 26 |
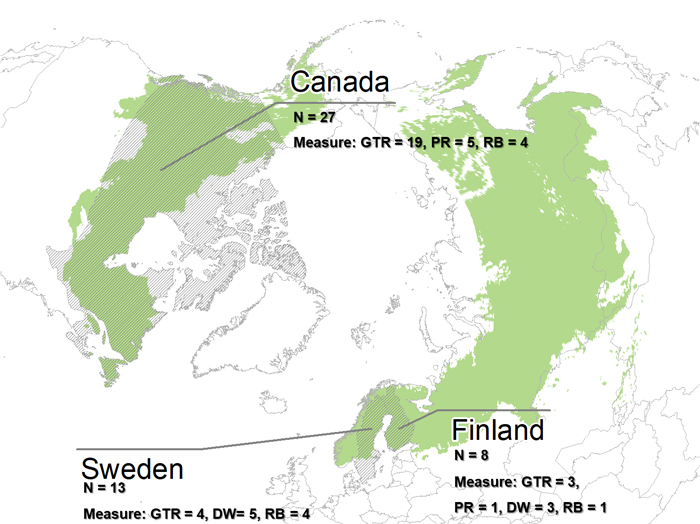
Fig. 2. The extent of the boreal forest (green) (Patapov et al. 2008) and the countries included in the 48 final articles in the review (grey shading). Number of articles given by country per conservation measure. Conservation measures: GTR = Green tree retention, PR = Patch retention, DW = Dead wood retention and RB = Riparian buffer zone.
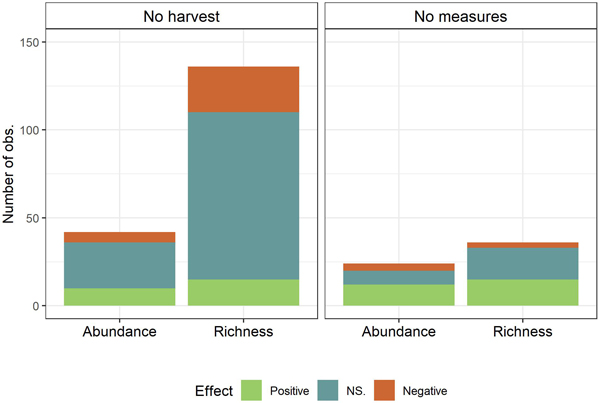
Fig. 3. Observed effects (Positive, NS. (Not significant), Negative) on biodiversity measures (Species richness and abundance) summed of all conservation measures by control (No harvest; No measures (Harvest with no measures)).
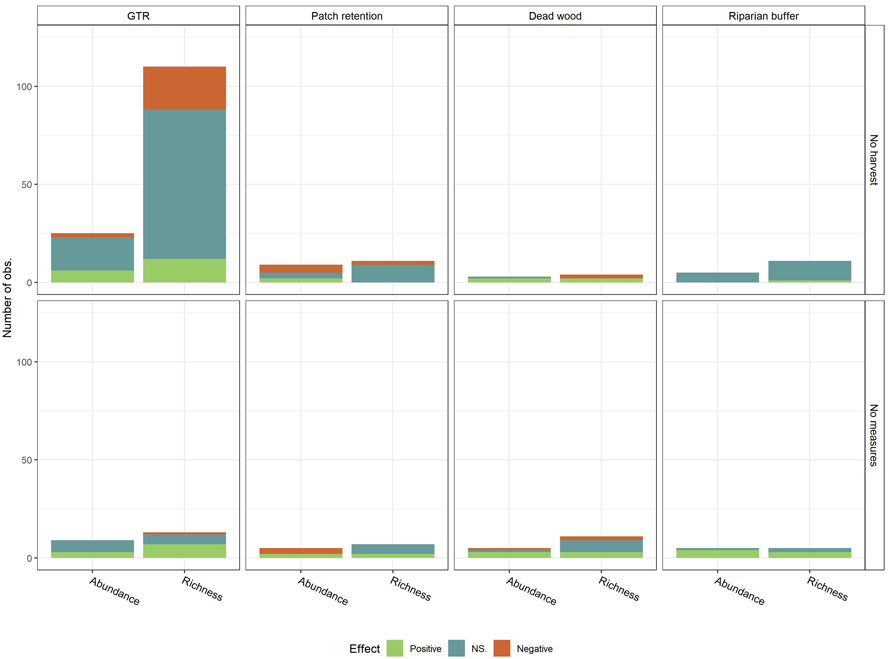
Fig. 4. Observed effects (Positive, NS. (Not significant), Negative) on biodiversity measures (Species richness and abundance) per conservation measure, by control (No harvest; No measures (Harvest with no measures)). Conservation measures include green tree retention (GTR), Patch retention (PR), Dead wood retention (DW) and Riparian buffer zone (RB). View larger in new window/tab.
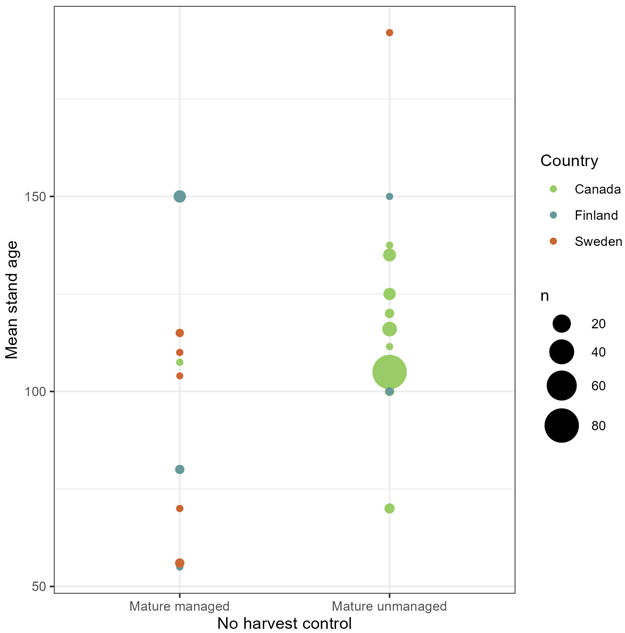
Fig. 5. Number of observations (n) with mean stand age and geographical location in the no-harvest control, divided by sub-category (mature managed forest and mature unmanaged forest).
| Table 4. Number of observations by effect (Positive, NS. (Not significant), and Negative), of green tree retention (GTR) as conservation measure, per GTR level, control (Harvest with no measures, No-harvest) and biodiversity measure (Species richness, abundance). GTR levels include Low (<10% retention) Medium (10–30% retention) and High (>30% retention). | |||||||||
| Control | Effect | Species richness | Abundance | ||||||
| Low | Medium | High | Total | Low | Medium | High | Total | ||
| Harvest with no measures | Positive | 3 (43%) | 3 (75%) | 1 (50%) | 7 (54%) | 2 (40%) | 1 (33%) | 0 | 3 (33%) |
| NS. | 4 (57%) | 1 (25%) | 0 | 5 (38%) | 3 (60%) | 2 (67%) | 1 (100%) | 6 (67%) | |
| Negative | 0 | 0 | 1 (50%) | 1 (8%) | 0 | 0 | 0 | 0 | |
| Sum | 7 (100%) | 4 (100%) | 2 (100%) | 13 (100%) | 5 (100%) | 3 (100%) | 1 (100%) | 9 (100%) | |
| No-harvest | Positive | 2 (5%) | 7 (19,5%) | 3 (9%) | 12 (11%) | 3 (27%) | 2 (25%) | 1 (17%) | 6 (24%) |
| NS. | 28 (70%) | 22 (61%) | 26 (76%) | 76 (69%) | 7 (64%) | 5 (63%) | 5 (83%) | 17 (68%) | |
| Negative | 10 (25%) | 7 (19,5%) | 5 (15%) | 22 (20%) | 1 (9%) | 1 (13%) | 0 | 2 (8%) | |
| Sum | 40 (100%) | 36 (100%) | 34 (100%) | 110 (100%) | 11 (100%) | 8 (100%) | 6 (100%) | 25 (100%) | |
| Table 5. Number of observations by effect (Positive, NS. (Not significant), and Negative) of patch retention (PR) as conservation measure, per PR level, control (Harvest with no measures, No-harvest) and biodiversity measure (Species richness and abundance). PR levels (size) include Small (< 0.4 ha), Medium (0.4–0.8 ha) and Large (> 0.8 ha). | |||||||||
| Control | Effect | Species richness | Abundance | ||||||
| Low | Medium | Large | Total | Low | Medium | Large | Total | ||
| Harvest with no measures | Positive | 1 (33%) | 0 | 1 (50%) | 2 (29%) | 1 (50%) | 0 | 1 (50%) | 2 (40%) |
| NS. | 2 (67%) | 2 (100%) | 1 (50%) | 5 (71%) | 0 | 0 | 0 | 0 | |
| Negative | 0 | 0 | 0 | 0 | 1 (50%) | 1 (100%) | 1 (50%) | 3 (60%) | |
| Sum | 3 (100%) | 2 (100%) | 2 (100%) | 7 (100%) | 2 (100%) | 1 (100%) | 2 (100%) | 5 (100%) | |
| No-harvest | Positive | 0 | 0 | 0 | 0 | 1 (25%) | 1 (50%) | 0 | 2 (22%) |
| NS. | 3 (75%) | 3 (100%) | 3 (75%) | 9 (82%) | 1 (25%) | 1 (50%) | 1 (33%) | 3 (33%) | |
| Negative | 1 (25%) | 0 | 1 (25%) | 2 (18%) | 2 (50%) | 0 | 2 (67%) | 4 (44%) | |
| Sum | 4 (100%) | 3 (100%) | 4 (100%) | 11 (100%) | 4 (100%) | 2 (100%) | 3 (100%) | 9 (100%) | |
| Table 6. Number of observations by effect (Positive, NS. (Not significant), and Negative), of dead wood enhancement (DW) as conservation measure, per control (Harvest with no measures, No-harvest) and biodiversity measure (Species richness and abundance). | |||
| Control | Effect | Species richness | Abundance |
| Harvest with no measures | Positive | 3 (27%) | 3 (60%) |
| NS. | 6 (55%) | 1 (20%) | |
| Negative | 2 (18%) | 1 (20%) | |
| Sum | 11 (100%) | 5 (100%) | |
| No-harvest | Positive | 2 (50%) | 2 (67%) |
| NS. | 0 | 1 (33%) | |
| Negative | 2 (50%) | 0 | |
| Sum | 4 (100%) | 3 (100%) | |
| Table 7. Number of observations per effect (Positive, NS. (Not significant), and Negative) of riparian buffer zone (RB) as conservation measure, per control (Harvest with no measures, No-harvest) and biodiversity measure (Species richness and abundance). RB levels (width) include Narrow (1–10 m) and Wide (> 10 m). | |||||||
| Control | Effect | Species richness | Abundance | ||||
| Narrow | Wide | Total | Narrow | Wide | Total | ||
| Harvest with no measures | Positive | 3 (100%) | 0 | 3 (60%) | 2 (100%) | 2 (67%) | 4 (80%) |
| NS. | 0 | 2 (100%) | 2 (33%) | 0 | 1 (33%) | 1 (20%) | |
| Negative | 0 | 0 | 0 | 0 | 0 | 0 | |
| Sum | 3 (100%) | 2 (100%) | 5 (100%) | 2 (100%) | 3 (100%) | 5 (100%) | |
| No-harvest | Positive | 1 (25%) | 0 | 1 (9%) | 0 | 0 | 0 |
| NS. | 3 (75%) | 7 (100%) | 10 (91%) | 1 (100%) | 4 (100%) | 5 (100%) | |
| Negative | 0 | 0 | 0 | 0 | 0 | 0 | |
| Sum | 4 (100%) | 7 (100%) | 11 (100%) | 1 (100%) | 4 (100%) | 5 (100%) | |
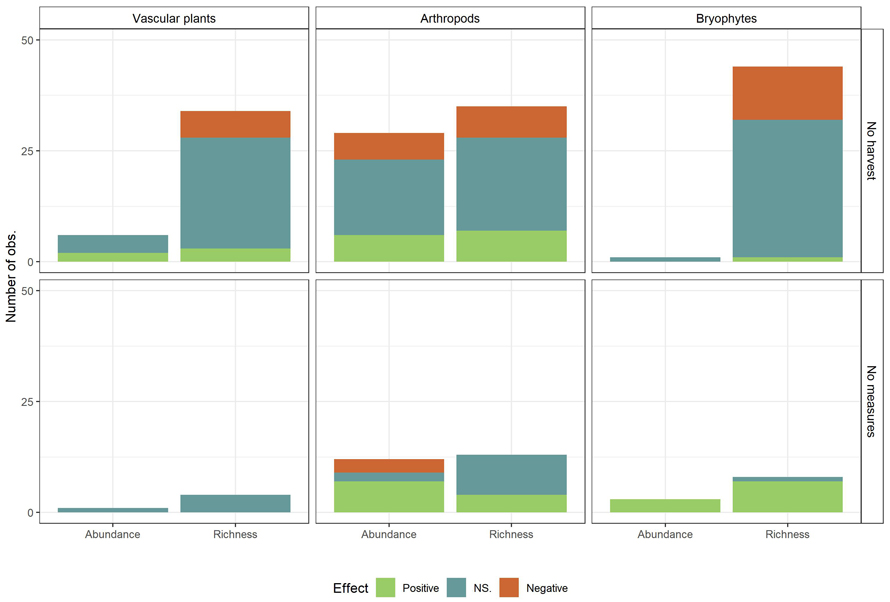
Fig. 6. Observed effects (Positive, NS. (Not significant), Negative) on biodiversity measures (Species richness and abundance) summed over all conservation measures, by control (No harvest; No measures (Harvest with no measures)) and taxa. Only taxa with sufficient number of observations are included. View larger in new window/tab.