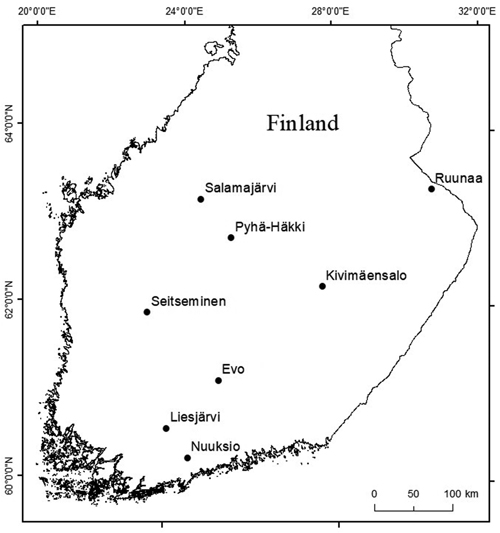
Fig. 1. Eight controlled burning sites in southern Finland marked with black dots. The test sites ‘Kivimäensalo’, ‘Liesjärvi’, ‘Pyhä-Häkki’, ‘Nuuksio’, and ‘Seitseminen’ were burned in 2021, whereas ‘Evo’, ‘Ruunaa’, and ‘Salamajärvi’ in 2022. All the test sites are located within national parks or protected areas.
| Table 1. Coordinates of the center of each test site, forest types, and dates of controlled burnings and pre- and post-fire terrestrial laser scanning (TLS) measurements. The test sites are located in southern Finland. | |||||
| Site | Coordinates (N, E) | Forest type | Pre-fire TLS | Burning | Post-fire TLS |
| Kivimäensalo | 62°18.419’, 27°41.495’ | mesic heath | 10 Jun 2021 | 6 Jul 2021 | 9 Sep 2021 |
| Liesjärvi | 60°39.043’, 24°1.070’ | sub-xeric heath | 16 Jun 2021 | 17 Jun 2021 | 5 Sep 2021 |
| Pyhä-Häkki | 62°51.358’, 25°25.417’ | sub-xeric heath | 13 Jun 2021 | 30 Jun 2021 | 7 Sep 2021 |
| Nuuksio | 60°19.484’, 24°32.349’ | sub-xeric heath | 6 Jun 2021 | 7 Jun 2021 | 30 Jun 2021 |
| Seitseminen | 61°58.080’, 23°24.735’ | sub-xeric heath | 20 Jun 2021 | 1 Jul 2021 | 6 Sep 2021 |
| Evo | 61°13.342’, 25°11.761’ | mesic heath | 3 Jun 2022 | 15 Aug 2022 | 18 Aug 2022 |
| Ruunaa | 63°22.814’, 30°30.132’ | sub-xeric heath | 9 Jun 2022 | 30 Jun 2022 | 3 Jul 2022 |
| Salamajärvi | 63°17.267’, 24°37.976’ | dry heath | 13 Jul 2022 | 16 Aug 2022 | 13 Sep 2022 |
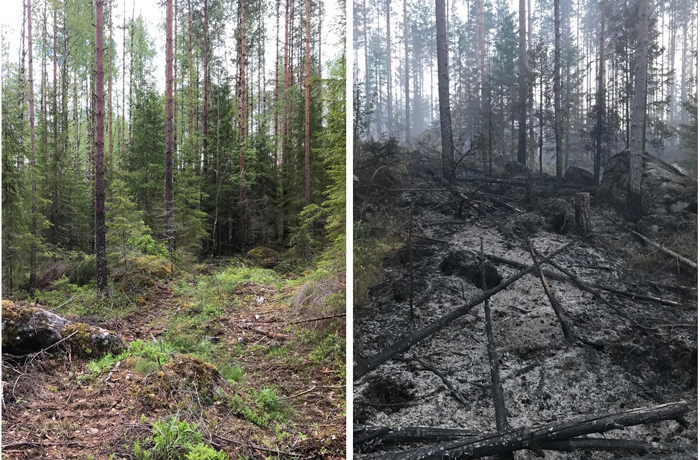
Fig. 2. The test site ‘Evo’ two months before (left) and a few days after (right) the controlled burning.
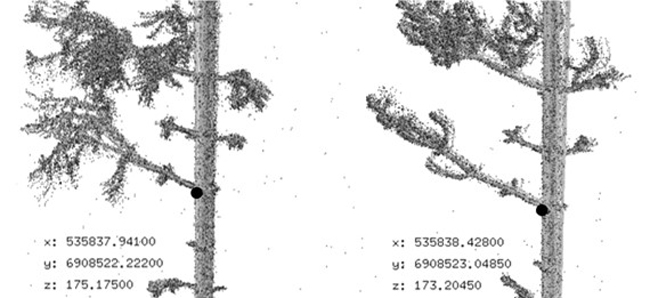
Fig. 3. Pre-fire point clouds (left) were aligned with post-fire point clouds (right) using a 3D transformation derived from common tie points, e.g., the large black dots in the figure. The tie points were manually extracted from the point clouds.
| Table 2. Stand characteristics and mean elevation of controlled burning sites. N = number of stems, G = basal area, Dg = basal area weighted mean diameter at breast height, Hg = basal area weighted mean height, Vol = stem volume, CC = canopy cover. The test sites are located in southern Finland. | |||||||||
| Site | Area (ha) | N (ha–1) | G (m2 ha–1) | Dg (cm) | Hg (m) | Vol (m3 ha–1) | CC (%) | Stand age (~y) | Elevation (m) |
| Kivimäensalo | 1.2 | 732 | 17.1 | 18.7 | 16.9 | 140 | 54 | 60 | 164 |
| Liesjärvi | 1.0 | 527 | 12.7 | 19.2 | 16.1 | 93 | 42 | 60 | 140 |
| Pyhä-Häkki | 1.0 | 1 147 | 31.4 | 21.7 | 18.3 | 261 | 79 | 70 | 176 |
| Nuuksio | 1.1 | 369 | 21.2 | 31.0 | 20.6 | 205 | 55 | 150 | 100 |
| Seitseminen | 1.0 | 687 | 25.3 | 24.3 | 21.6 | 260 | 55 | 50 | 184 |
| Evo | 1.2 | 751 | 23.7 | 26.3 | 18.6 | 210 | 68 | 60 | 171 |
| Ruunaa | 0.9 | 948 | 28.5 | 21.5 | 19.6 | 274 | 76 | 120 | 152 |
| Salamajärvi | 1.0 | 919 | 30.7 | 23.0 | 19.6 | 272 | 65 | 70 | 190 |
| Table 3. Recall, precision, and F1-score quantifying the performance of the classification method for identifying ‘burned’ and ‘unburned’ areas for each controlled burning site. | |||
| Site | Recall | Precision | F1-score |
| Kivimäensalo | 0.95 | 1.00 | 0.98 |
| Liesjärvi | 0.77 | 1.00 | 0.87 |
| Pyhä-Häkki | 0.95 | 0.95 | 0.95 |
| Nuuksio | 0.94 | 0.80 | 0.86 |
| Seitseminen | 0.80 | 1.00 | 0.89 |
| Evo | 0.87 | 0.65 | 0.74 |
| Ruunaa | 0.95 | 0.95 | 0.95 |
| Salamajärvi | 0.94 | 0.75 | 0.83 |
| Mean | 0.90 | 0.89 | 0.88 |
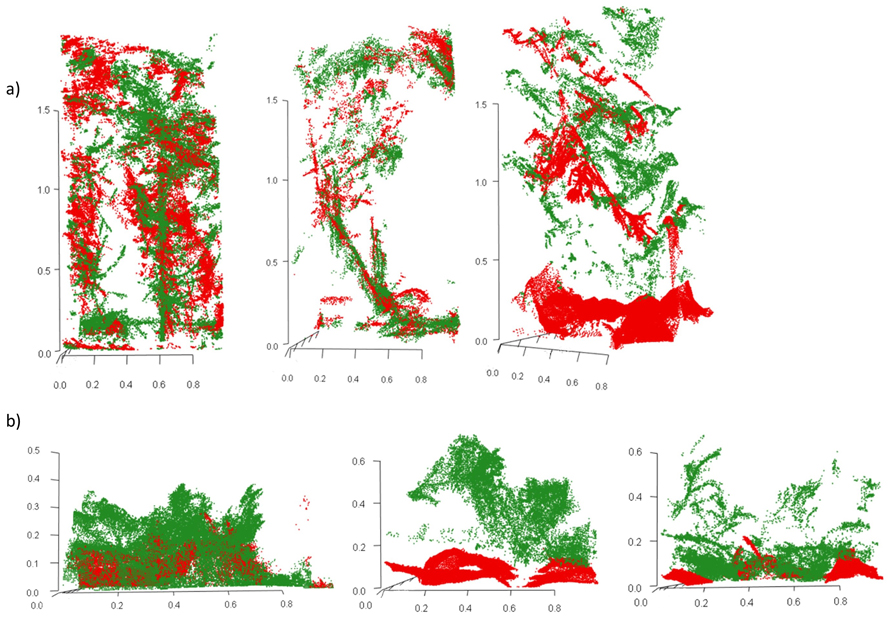
Fig. 4. Three 1 × 1 m cells from the test site ‘Evo’, classified as ‘burned’ by the developed classification method but as ‘unburned’ through visual interpretation (a), and three 1 × 1 m cells from the test site ‘Kivimäensalo’ classified as burned both by the developed method and visual interpretation (b). Pre-fire (green) and post-fire (red) point clouds are overlaid. View larger in new window/tab.
| Table 4. Proportions of 1 × 1 m cells classified as ‘burned’ and ‘unburned’ for each controlled burning site. | ||
| Site | Proportion of 1 × 1 m cells | |
| ‘Burned’ | ‘Unburned’ | |
| Kivimäensalo | 95% | 5% |
| Liesjärvi | 95% | 5% |
| Pyhä-Häkki | 92% | 8% |
| Nuuksio | 83% | 17% |
| Seitseminen | 94% | 6% |
| Evo | 51% | 49% |
| Ruunaa | 96% | 4% |
| Salamajärvi | 71% | 29% |
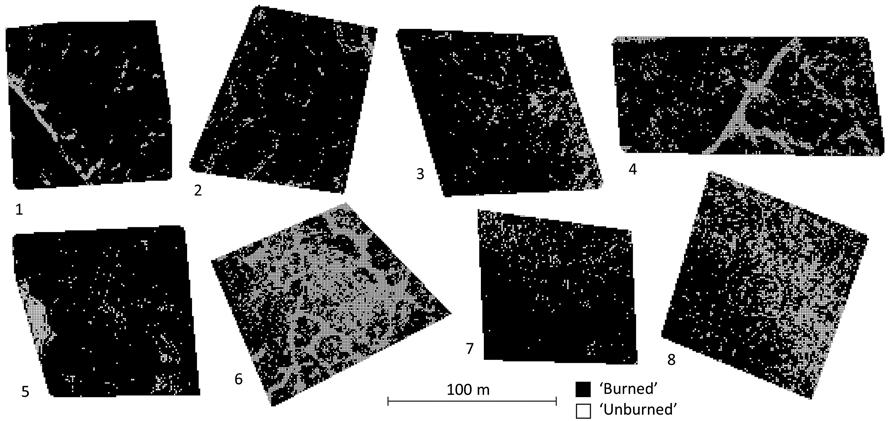
Fig. 5. Spatial distribution of 1 × 1 m cells classified as ‘burned’ and ‘unburned’ for each controlled burning site. Test sites are oriented in a north-south direction. 1 = Kivimäensalo, 2 = Liesjärvi, 3 = Pyhä-Häkki, 4 = Nuuksio, 5 = Seitseminen, 6 = Evo, 7 = Ruunaa, 8 = Salamajärvi.
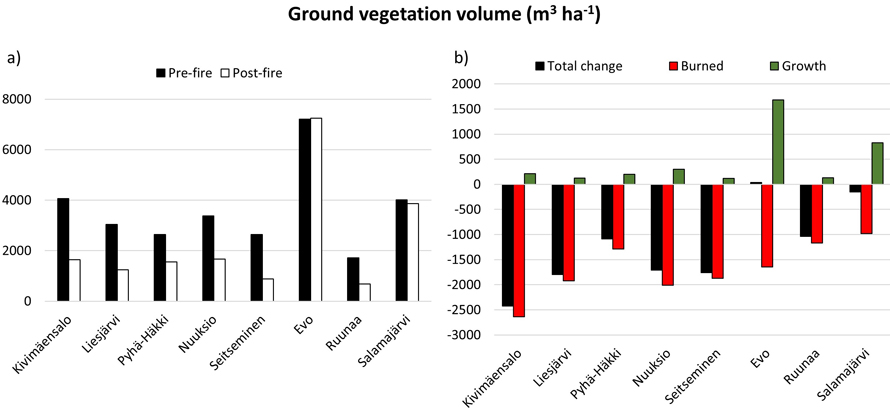
Fig. 6. Ground vegetation volumes (including tree stems below 2 m) before and after controlled burnings (a), and total changes (black) with burned (red) and growth (green) volumes (b) at a resolution of 0.1 m. Negative values indicate a decrease and positive values an increase in ground vegetation volume.
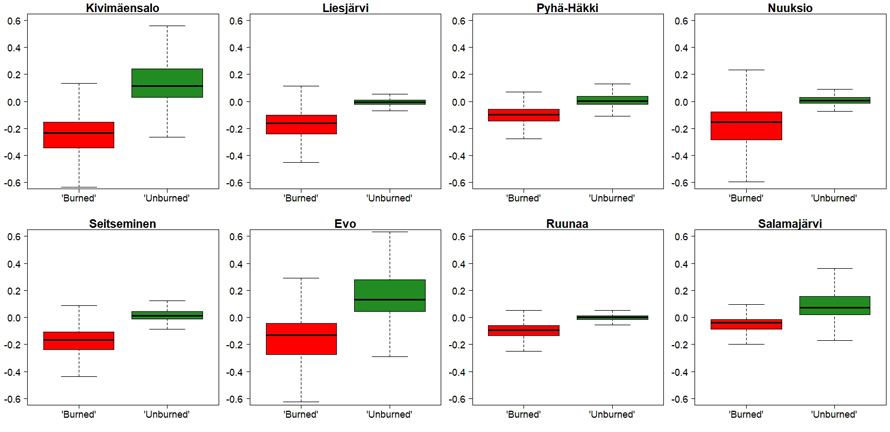
Fig. 7. Variation in ground vegetation volume changes in 1 × 1 m cells classified as ‘burned’ and ‘unburned’ in the controlled burning sites. The line in the box center represents the median value; the box represents the middle 50% of the cell values; 25% of the values fall below the lower quartile (bottom of the box), and 75% fall below the upper quartile (top of the box); whiskers represent minimum and maximum cell values. Outliers (i.e., 0.35% of the observations both above and below the whiskers) are not shown in the figure to enhance the display of data distribution and variability. View larger in new window/tab.