| Table 1. The number of ignition tests performed in the study by species, moisture content and wind velocity. Total number of tests: 293, location of the study: Evo state forest, Hämeenlinna, Finland. |
| Wind velocity 0 m s–1 |
| Moisture content | 11% | 25% | 43% | 67% | 100% |
| Species |
| Pleurozium schreberi | 6 | 5 | 5 | 5 | 5 |
| Dicranum spp. | 5 | -^ | 2 | 5 | 5 |
| Hylocomium splendens | 5 | 4 | 5 | 5 | 5 |
| Cladonia rangiferina | 5 | 5 | 5 | 5 | 5 |
| | Wind velocity 1 m s–1 |
| Pleurozium schreberi | 5 | 4 | 5 | 5 | 4 |
| Dicranum spp. | 5 | 4 | 3 | 7 | 4 |
| Hylocomium splendens | 5 | 7 | 7 | 5 | 4 |
| Cladonia rangiferina | 3 | 5 | 6 | 6 | 6 |
| | Wind velocity 2 m s–1 |
| Pleurozium schreberi | 6 | 5 | 4 | 6 | 5 |
| Dicranum spp. | 5 | 8 | 4 | 4 | 5 |
| Hylocomium splendens | 5 | 5 | 5 | 5 | 5 |
| Cladonia rangiferina | 6 | 5 | 5 | 4 | 4 |
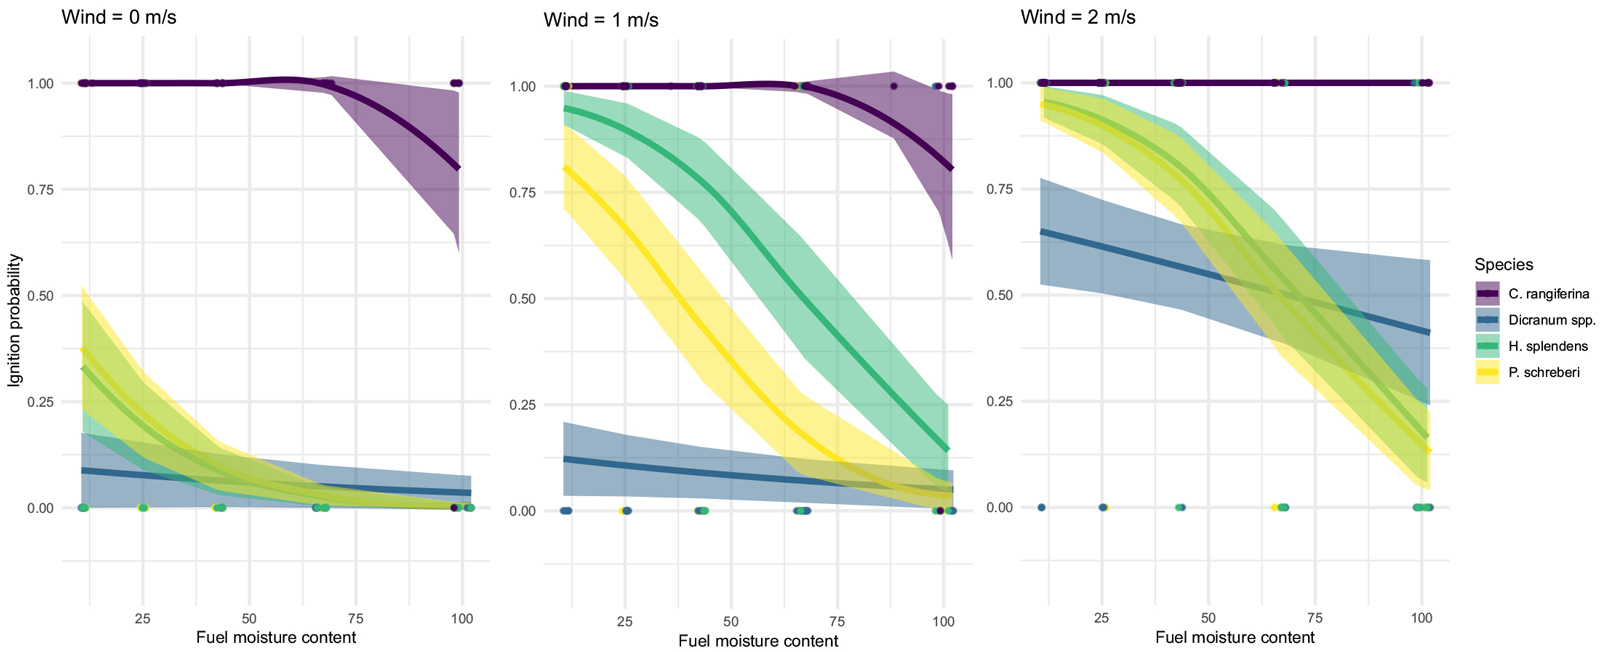
Fig. 1. Ignition probabilities of the studied species by wind velocity and fuel moisture content (%, dry weight basis) of used logistic regression models. Shaded areas show the standard errors of each fitted model and dots show the original measured observations. View larger in new window/tab.
| Table 2. Coefficients of the logistic regression model (ignition probability analysis). |
| Species | Variable | Estimate | Std. error | p |
| Cladonia rangiferina | Intercept | 14.08 | 13.22 | 0.28 |
| Moisture% | –0.13 | 0.14 | 0.34 |
| Wind 1 m s–1 | 0.35 | 1.59 | 0.83 |
| Wind 2 m s–1 | 18.26 | 4715.29 | 1 |
| Dicranum spp. | Intercept | 2.22 | 1.14 | 0.05 |
| Moisture% | –0.01 | 0.01 | 0.30 |
| Wind 1 m s–1 | 0.36 | 1.27 | 0.78 |
| Wind 2 m s–1 | 2.95 | 1.11 | 0.01** |
| Hylocomium splendens | Intercept | –0.14 | 0.75 | 0.86 |
| Moisture% | –0.05 | 0.01 | <0.001*** |
| Wind 1 m s–1 | 3.60 | 0.96 | <0.001*** |
| Wind 2 m s–1 | 3.78 | 0.99 | <0.001*** |
| Pleurozium schreberi | Intercept | 0.06 | 0.68 | 0.92 |
| Moisture% | –0.05 | 0.01 | <0.001*** |
| Wind 1 m s–1 | 1.95 | 0.81 | 0.016** |
| Wind 2 m s–1 | 3.45 | 0.92 | <0.001*** |
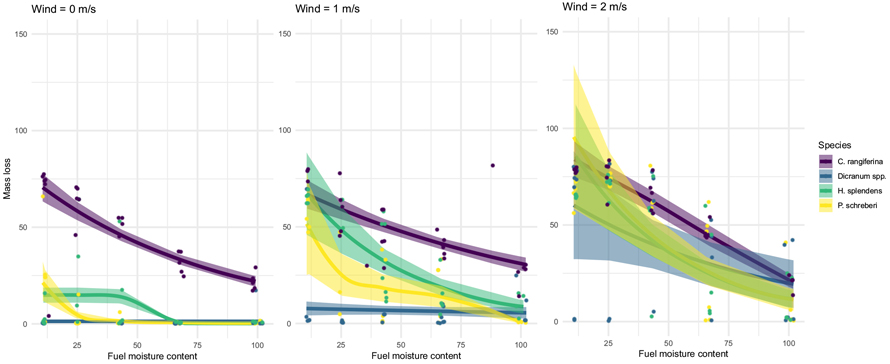
Fig. 2. Mass losses (%, dry weight) of the studied species by wind velocity and fuel moisture content (%, dry weight basis) of used generalized additive models. Shaded areas show the standard errors of each fitted model and dots show the original measured observations. View larger in new window/tab.
| Table 3. Parametric coefficients and significances of smoother terms of generalized additive model (mass loss analysis). Edf: efficient degrees of freedom. |
| Species | Variable/Smooth term | Estimate | Std.error | p | edf |
| Cladonia rangiferina | Parametric coefficients |
| Intercept | 4.43 | 0.12 | <0.001*** | |
| Wind 1 m s–1 | –0.11 | 0.18 | 0.54 | |
| Wind 2 m s–1 | 0.11 | 0.21 | 0.60 | |
| Smooth terms |
| s(moisture): wind 0 m s–1 | | | <0.001*** | 1.03 |
| s(moisture): wind 1 m s–1 | | | <0.001*** | 0.98 |
| s(moisture): wind 2 m s–1 | | | <0.001*** | 1.80 |
| Dicranum spp. | Parametric coefficients |
| Intercept | 0.27 | 0.38 | 0.48 | |
| Wind 1 m s–1 | 1.83 | 0.67 | 0.008** | |
| Wind 2 m s–1 | 3.99 | 0.68 | <0.001*** | |
| Smooth terms | | | | |
| s(moisture): wind 0 m s–1 | | | ̶̶ | 0 |
| s(moisture): wind 1 m s–1 | | | 0.66 | 0.65 |
| s(moisture): wind 2 m s–1 | | | 0.21 | 1.11 |
| Hylocomium splendens | Parametric coefficients |
| Intercept | 2.70 | 0.26 | <0.001*** | |
| Wind 1 m s–1 | 1.80 | 0.47 | <0.001*** | |
| Wind 2 m s–1 | 2.06 | 0.47 | <0.001*** | |
| Smooth terms |
| s(moisture): wind 0 m s–1 | | | <0.001*** | 1.00 |
| s(moisture): wind 1 m s–1 | | | <0.001*** | 0.93 |
| s(moisture): wind 2 m s–1 | | | 0.001** | 1.11 |
| Pleurozium schreberi | Parametric coefficients |
| Intercept | 4.81 | 1.44 | 0.001** | |
| Wind 1 m s–1 | 0.04 | 2.44 | 0.99 | |
| Wind 2 m s–1 | 0.05 | 1.52 | 0.97 | |
| Smooth terms |
| s(moisture): wind 0 m s–1 | | | <0.001*** | 2.38 |
| s(moisture): wind 1 m s–1 | | | <0.001*** | 3.20 |
| s(moisture): wind 2 m s–1 | | | 0.05* | 1.24 |