| Table 1. The treatments and harvester’s working methods used on the plots of two storeyed stands of silver birch (Betula pendula) and Norway spruce (Picea abies). | ||
| Symbol | Treatment (cutting and harvester’s working method) | Definition |
| RTH | Release thinning | 50–60% of dominant birch layer was cut with precautions against damage to the lower spruce understory. |
| TH | Thinning | 50–60% of the birches were cut without care of few or no understory spruces. |
| RLC | Release cutting | All dominating birches were removed with precautions against damage to the lower spruce understory. |
| CC | Clear cutting | All trees were removed in the study units that had few or no understory spruces. |
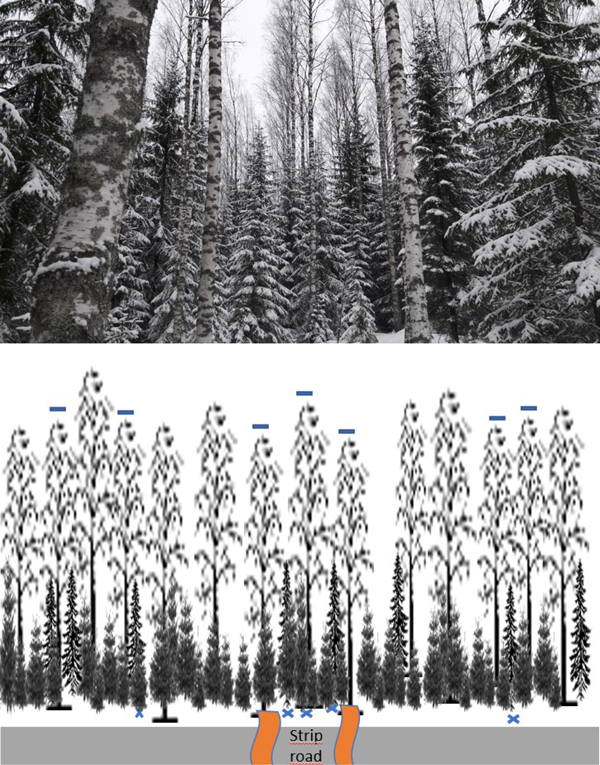
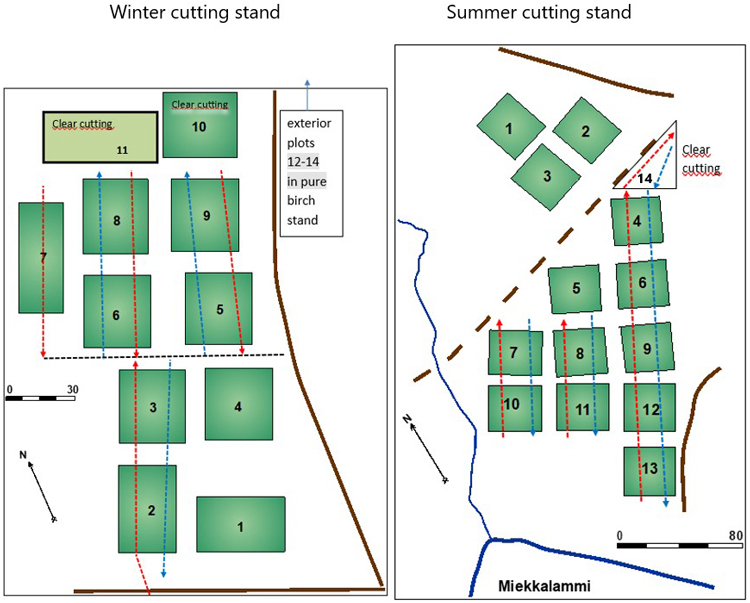
Fig. 2. The photo from winter cutting stand in Äänekoski just before cutting and the scheme of treatment RTH (release thinning), when about half of birches will be cut (–) and also pulp wood sized spruces from the strip road as well as some spruces hindering birch cutting on the area outside roads (X). In treatment release cutting (RLC) all birches will be cut.
| Table 2. Stand characteristics before treatments and the thinning removal of birch. The treatments are described in Table 1. | ||||||||
| Treatment | Nb. of plots | Silver birch | Norway spruce | |||||
| D1.3 (cm)* | N (ha–1) | G (m2 ha–1) | Vcommercial (m3 ha–1) | N (ha–1) | H (m)* | D1.3 (cm)* | ||
| Crowing stock before cutting: | ||||||||
| RTH winter cutting: mean | 2 | 21.1 | 610 | 21.6 | 257 | 1425 | 6.8 | 5.6 |
| st. deviation | 2.1 | 127 | 0.2 | 14 | 92 | 1.4 | 0.4 | |
| RTH summer cutting: mean | 3 | 20.8 | 357 | 11.9 | 134 | 1650 | 11.1 | 9.8 |
| st. deviation | 1.9 | 110 | 2.0 | 21 | 185 | 0.3 | 0.2 | |
| TH winter cutting: mean | 2 | 20.2 | 875 | 27.2 | 300 | - | - | - |
| st. deviation | 2.5 | 389 | 10.1 | 150 | - | - | - | |
| RLC winter cutting: mean | 4 | 19.9 | 718 | 18.7 | 213 | 1365 | 7.0 | 5.5 |
| st. deviation | 4.7 | 635 | 8.9 | 88 | 660 | 1.1 | 1.8 | |
| RLC summer cutting: mean | 5 | 18.5 | 732 | 17.6 | 199 | 1790 | 11.0 | 9.4 |
| st. deviation | 3.2 | 489 | 6.1 | 72 | 141 | 1.0 | 0.7 | |
| CC winter cutting: mean | 4 | 21.8 | 445 | 17.6 | 191 | 124 | 8.7 | 10.4 |
| st. deviation | 3.1 | 22 | 4.0 | 66 | 212 | - | - | |
| CC summer cutting: | 1 | 18.7 | 837 | 23.6 | 263 | 492 | 13.0 | 12.4 |
| Thinning removal: | ||||||||
| RTH winter cutting: mean | 2 | 24.8 | 290 | 10.2 | 122 | |||
| st. deviation | 1.8 | 42 | 1.1 | 22 | ||||
| RTH summer cutting: mean | 3 | 20.8 | 207 | 6.8 | 77 | |||
| st. deviation | 1.9 | 68 | 1.3 | 14 | ||||
| TH winter cutting: mean | 2 | 20.4 | 622 | 16.3 | 180 | |||
| st. deviation | 1.6 | 295 | 5.3 | 65 | ||||
| * = arithmetic mean. | ||||||||
| Table 3. Main work processes used in time and motion study of harvesters’ working methods in two-storied stands. | |
| Main work process | Description |
| Cutting birches | Started when the boom began to swing toward a tree and ended after the final cross-cut through the last log of the stem. Included work phases: extend the boom and grasp, felling, processing (delimbing and cross-cutting the logs). |
| Cutting spruces | As above for birch. |
| Moving | Started when the harvester moved forward or backward and ended when the harvester stops. Included work phases: moving backward and forward between working locations and in the working location (Nuutinen 2013). |
| Arranging products | Started when the boom started to move and ended when the head was ready for the next tree. Included work phases: bunching and sorting logs, moving tops and branches, removal of understory from around standing trees that must be felled and work planning maximum 100 seconds (= time when harvester has no functions). |
| Table 4. Mean work time consumption (sec tree–1) and its standard deviation (±SD) recorded from the video material devoted to each main work process and treatment; n = number of basic observations. | ||||||||||||
| Main work process | Treatment | |||||||||||
| Release thinning (RTH) | Release cutting (RLC) | Thinning (TH) | Clear cutting (CC) | |||||||||
| sec tree–1 | ±SD | n | sec tree–1 | ±SD | n | sec tree–1 | ±SD | n* | sec tree–1 | ±SD | n* | |
| Cutting birch | 29.7 | 9.3 | 158 | 27.1 | 10.6 | 635 | 31.8 | 12.2 | 64 | 24.7 | 8.6 | 277 |
| Cutting spruce | 13.6 | 4.7 | 97 | 15.1 | 5.7 | 174 | 14.3 | 4.7 | 107 | |||
| Moving | 9.2 | 6.5 | 176 | 8.7 | 6.5 | 341 | 8.4 | 6.2 | 39 | 6.5 | 5.4 | 161 |
| Arranging products | 10.5 | 5.2 | 56 | 11.9 | 7.1 | 104 | 11.8 | 7.1 | 8 | 11.5 | 6.0 | 44 |
| * = exterior plots are not included. | ||||||||||||
| Table 5. The characteristics of the test cutting’s removal of silver birch and Noway spruce. The treatments are described in Table 1. | ||||||||||||
| Treatment | No. of plots | Cutting sequences* | No. of stems | Arithmetic mean dbh (cm) | Commercial volume (m3) | Commercial mean stem volume (m3)** | ||||||
| Birch | Spruce | Birch | Spruce | Birch | Spruce | Birch | Spruce | |||||
| Mean** | ±SD | Mean** | ±SD | |||||||||
| RTH | 5 | 8 | 158 | 97 | 19.7 | 3.2 | 11.7 | 2.5 | 49.2 | 5.6 | 0.311 | 0.058 |
| RLC | 9 | 14 | 635 | 174 | 18.7 | 2.9 | 11.3 | 2.0 | 159.9 | 8.9 | 0.252 | 0.051 |
| TH | 2 | 3 | 112 | - | 18.3 | 4.6 | - | 32.3 | - | 0.288 | ||
| CC | 5 | 6 | 302 | 80 | 19.9 | 4.4 | 13.2 | 3.1 | 97.1 | 4.7 | 0.322 | 0.059 |
| Total | 21 | 30 | 1207 | 351 | 19.1 | 3.4 | 11.6 | 2.3 | 338.5 | 19.2 | 0.280 | 0.055 |
| * = Sequences according to cutting direction: 1 = entry, 2 = re-entry. “Entry” meant cutting through the plot with uncut forest on both sides of the harvester and “re-entry” meant at least the other side of cutting sector bordered a recently managed forest area. ** = Commercial mean stem volume (m3) = Commercial Volume (m3) / No. of stems. | ||||||||||||
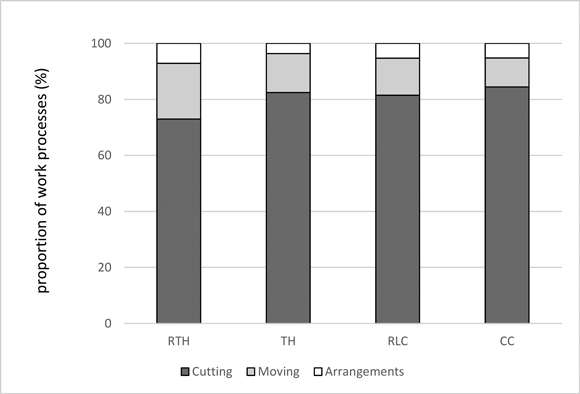
Fig. 3. Average relative time consumption of the main work processes of the thinning treatments for spruces and birches. The treatments are defined in Table 1. The main work processes and work phases are defined in Table 3.
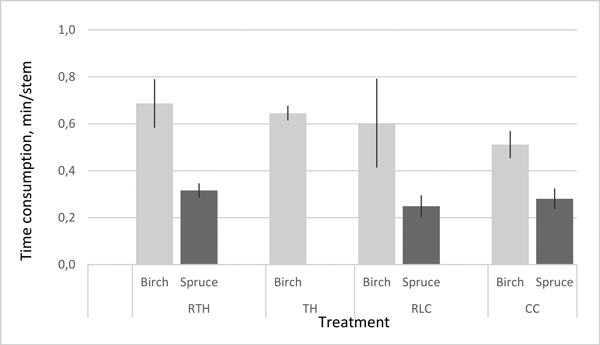
Fig. 4. The average time consumption of main work processes cutting birches and spruces for the treatments. Line segments identify the ±SD of time consumption values in each treatment, which are defined in Table 1.
| Table 6. Statistical information of regression models for time consumption of main work process cutting (defined in Table 3). Dependent variables: E0min m–3 of cutting birches and cutting spruces. Thinning treatments are defined in Table 1. | ||||||
| Parameter: | Model 1: Cutting birches (N = 27, Pseudo R2 = 0.89) | Model 2: Cutting birches (N = 27, Pseudo R2 = 0.89) | Model 3: Cutting spruces (N = 23, Pseudo R2 = 0.72) | |||
| F-value | Sig. | F-value | Sig. | F-value | Sig. | |
| Intercept | 47.16 | 0.000 | 46.24 | 0.000 | 6.42 | 0.019 |
| Treatment | 4.80 | 0.010 | 5.46 | 0.006 | 2.98 | 0.072 |
| 1/Vmean, m–3 | 63.18 | 0.000 | 60.84 | 0.000 | 41.93 | 0.000 |
| NBremov, ha–1 | 6.38 | 0.019 | 7.14 | 0.014 | ||
| Treatment × NBrem | 3.55 | 0.031 | 3.68 | 0.028 | ||
| Direction | 2.05 | 0.167 | ||||
| Fixed effects | Coefficient | Sig. | Coefficient | Sig. | Coefficient | Sig. |
| Intercept | 0.6117 | 0.008 | 0.670 | 0.004 | 0.9815 | 0.154 |
| RTH | 0.0675 | 0.819 | 0.199 | 0.514 | 0.8604 | 0.066 |
| TH | 0.5868 | 0.123 | 0.584 | 0.117 | ||
| RLC | 0.6300 | 0.005 | 0.711 | 0.002 | 1.0309 | 0.024 |
| CC | 0 | 0 | 0 | |||
| 1/Vmean, m–3 | 0.2658 | 0.000 | 0.258 | 0.000 | 0.2133 | 0.000 |
| NBremov, ha–1 | 0.0002 | 0.477 | 0.0003 | 0.305 | ||
| RTH × NBremov | 0.0022 | 0.028 | 0.0020 | 0.047 | ||
| TH × NBremov | 0.00001 | 0.980 | 0.00003 | 0.954 | ||
| RLC × NBremov | –0.0004 | 0.248 | –0.0005 | 0.164 | ||
| CC × NBremov | 0 | 0 | ||||
| Entry | 0.0792 | 0.167 | ||||
| Re-entry | 0 | |||||
| Random effects | Estimate | Std. error | Estimate | Std. error | Estimate | Std. error |
| Residual | 0.0193 | 0.0058 | 0.0184 | 0.0057 | 0.5141 | 0.1587 |
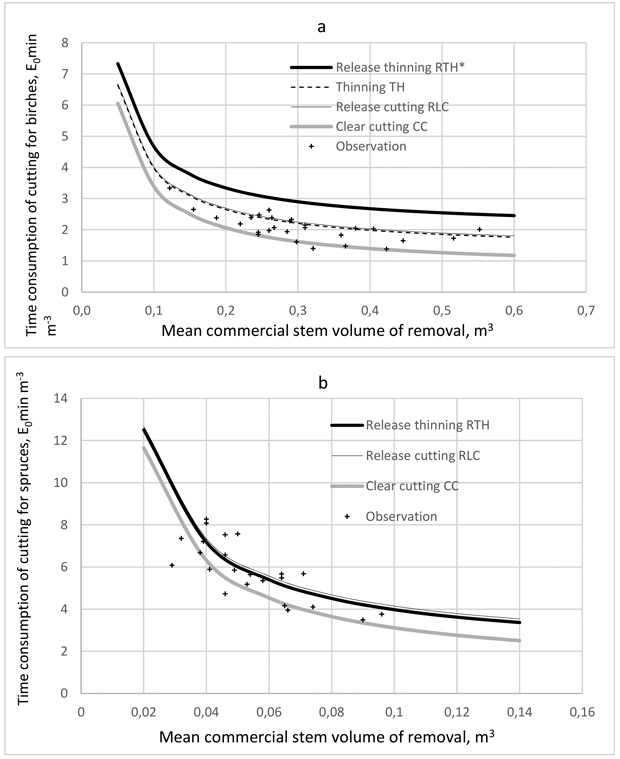
Fig. 5. Time consumption of main work process cutting birches (Model 1) with the average density of birch removal of 550 stems ha–1 (a) and cutting understory spruces (Model 3) (b). The treatments are defined in Table 1. The main work processes and work phases are defined in Table 3. * = The curve of release thinning (RTH) lays above the observation points with 250 removed birches ha–1 on average instead of 550 stems ha–1 for the curve.
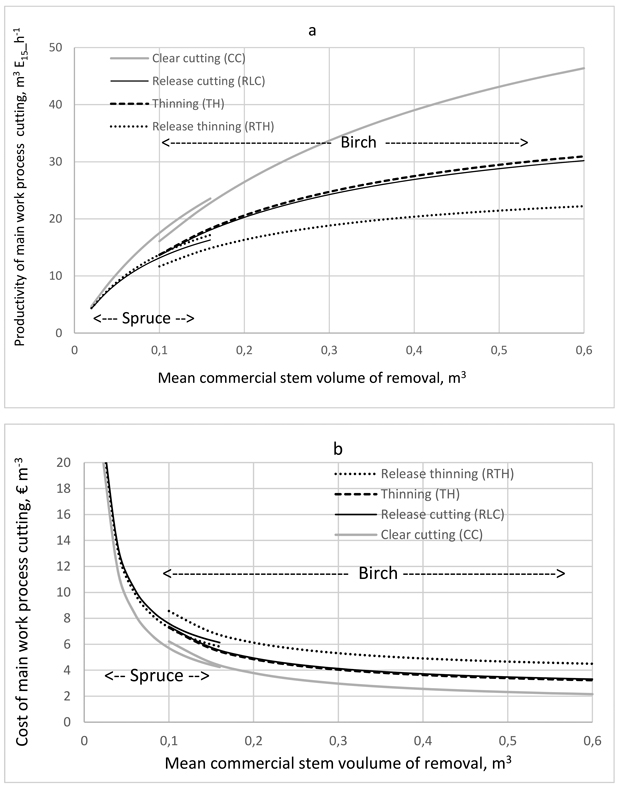
Fig. 6. E15 average productivities (a) and costs (b) of main work processes cutting birches and understory spruces for thinning treatments. The treatments are defined in Table 1. The main work processes and work phases are defined in Table 3.
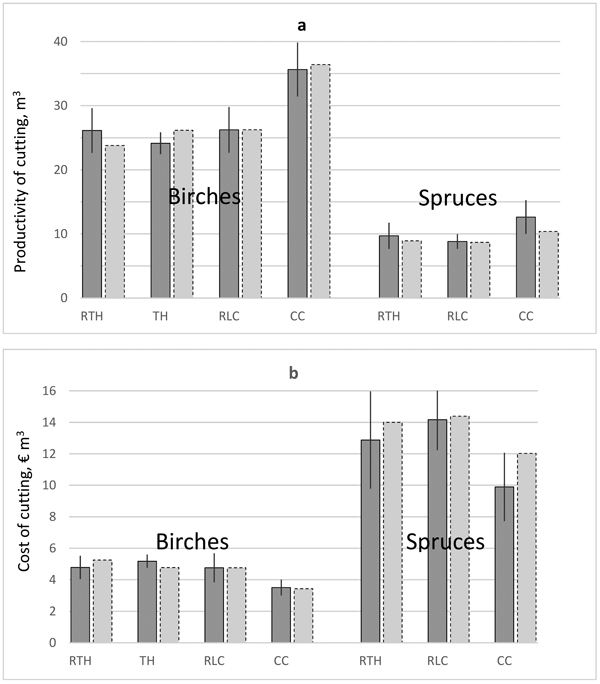
Fig. 7. Average E15 productivities (a) and costs (b) of the main work process of cutting for treatments as the means in study data (solid bars) and calculated by models 1 and 3 for justified stand parameters according to practice (dashed bars). Line segments identify the ±SD of values in each thinning treatment. The treatments are defined in The main work processes and work phases are defined in Table 3.
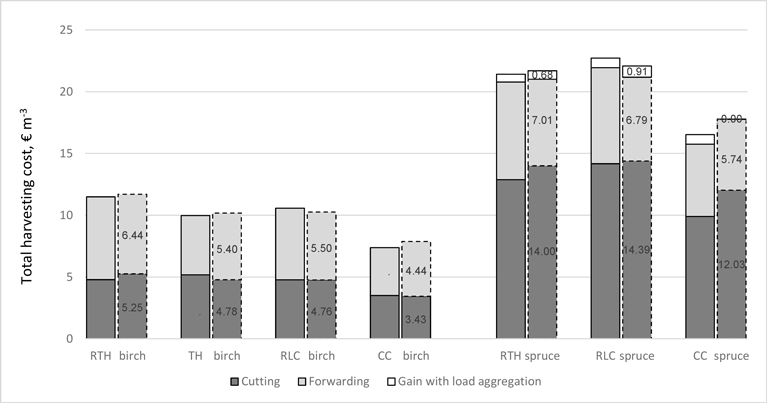
Fig. 8. Harvesting (harvester work and forwarding) costs with separate timber assortment loads or aggregation-loads of birch plywood logs and spruce pulpwood logs as the means in study data (solid bars) and calculated by models for justified stand parameters according to practice (dashed bars). The treatments are defined in Table 1.
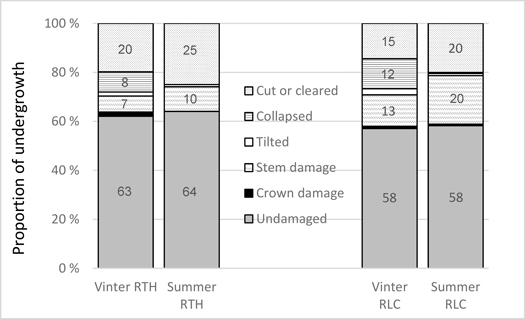
Fig. 9. Harvesting damage of understory spruces in release thinning (RTH) and release cutting (RLC) in winter cutting stand 1 and summer cutting stand 2. The treatments are described in Table 1, stand characteristics before treatments in Table 2.
| Table 7. Statistical information of regression models 4–6 for the undamaged and stem damaged proportions (%) of prior to treatment number of understory spruces in both release cutting (RLC) and release thinning (RTH). No significant difference in appearance of damage between RLC and RTH. | |||||
| Variable | Coefficient | Std. error | Denominator df | t-value | Sig. |
| Dependent = % of undamaged spruces of post treatment understory, NStand 1 = 6 ja NStand 2 = 8 | |||||
| Model 4 (Pseudo R2 = 0.43) | |||||
| Fixed effects: | |||||
| Intercept | 72.901 | 4.472 | 12 | 16.30 | 0.000 |
| Harvest removal, m3 ha–1 | –0.0780 | 0.025 | 12 | –3.15 | 0.008 |
| Random effects | Estimate | Std. error | |||
| Stand | * | * | |||
| Residuals | 47.79 | 19.50 | |||
| Model 5 (Pseudo R2 = 0.43) | |||||
| Fixed effects: | |||||
| Intercept | 39.133 | 17.38 | 3.45 | 2.25 | 0.098 |
| Harvest removal, m3 ha–1 | –0.0664 | 0.020 | 9.24 | –3.29 | 0.009 |
| Prior treatm. Nsp, ha–1 | 0.0215 | 0.0095 | 8.05 | 2.27 | 0.052 |
| Random effects | Estimate | Std. error | |||
| Stand | 163.8 | 298.3 | |||
| Residuals | 29.7 | 14.0 | |||
| Dependent = % of stem damaged spruces of post treatment understory, NStand 1 = 6 ja NStand 2 = 8 | |||||
| Model 6 (Pseudo R2 = 0.72) | |||||
| Fixed effects: | |||||
| Intercept | 3.746 | 3.030 | 10 | 1.237 | 0.244 |
| Stand 1 (Stand 2 = reference) | –4.772 | 2.548 | 10 | –1.873 | 0.091 |
| Harvest removal, m3 ha–1 | 0.077 | 0.016 | 10 | 4.780 | 0.001 |
| Random effects | Estimate | Std. error | |||
| Residuals | 19.94 | 8.92 | |||
| * = The covariance parameter is redundant. | |||||
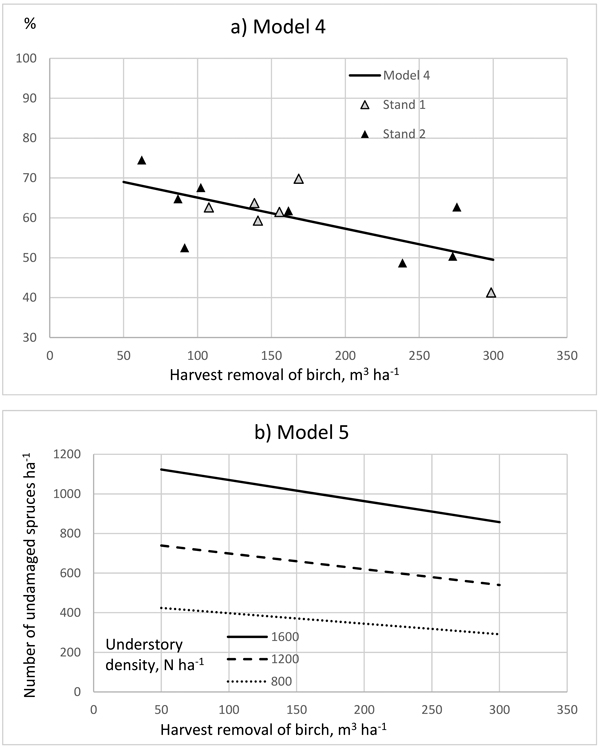
Fig. 10. Average proportion (a) and number per ha (b) of undamaged understory spruces (per study units) in winter cutting stand 1 and summer cutting stand 2 after the treatments according to models 4 and 5 (Table 7).
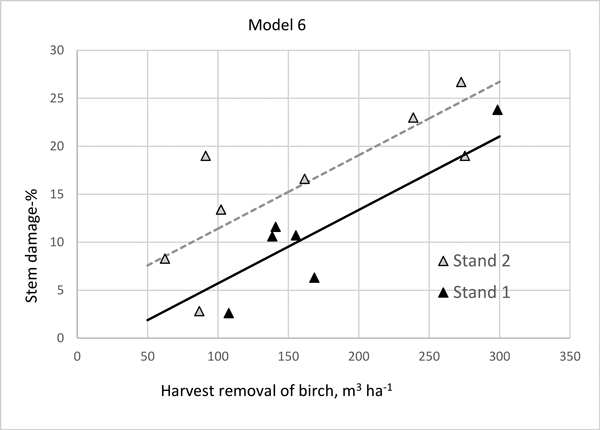
Fig. 11. Average proportion of stem damaged understory spruces in winter cutting stand 1 and summer cutting stand 2 after the treatments according to model 6 (Table 7).
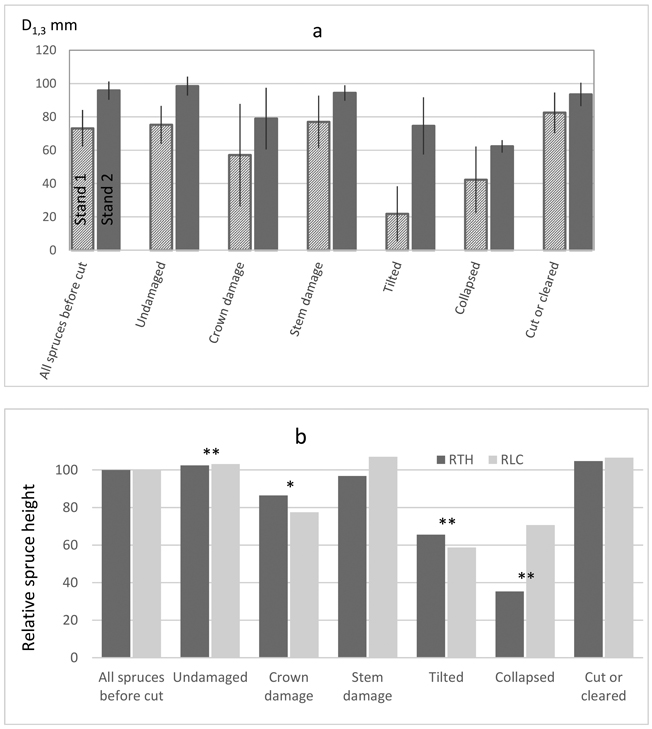
Fig. 12. Means and standard deviations (vertical lines) of dbh of undamaged and damaged understory spruces in terms of mm in winter cutting stand 1 and summer cutting stand 2 (a) and in terms of % in treatments RTH and RLC (100 = all spruces before treatments) (b). * means that the size of spruces differ significantly from that of all spruces with a risk < 5%. * means a risk < 10%, respectively. The treatments are defined in Table 1.