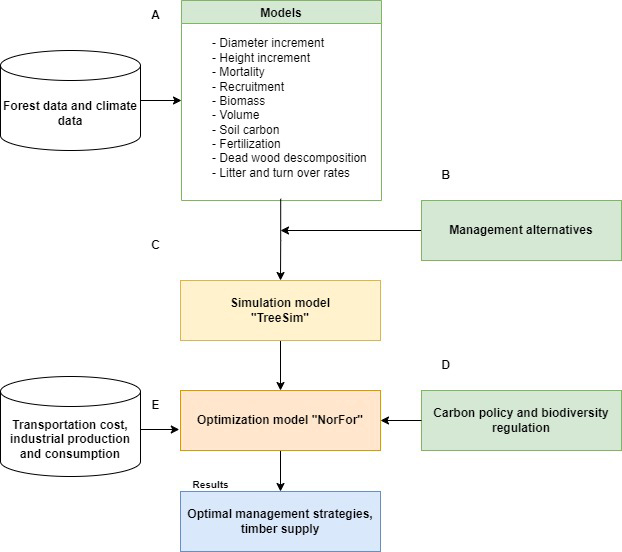
Fig. 1. Workflow of the study, including: (A) forest data preparation from the National Forest Inventory (NFI) and climate data from the Meteorological Institute, and models to simulate forest dynamics, (B) setting of forest management alternatives, (C) forest management simulation, (D) setting of carbon policy and biodiversity regulation scenarios, and (E) optimization that yields the area per management regime for each scenario. Adapted from Nabhani and Sjølie (2022).
| Table 1. Forest management alternatives implemented in TreeSim. Considering two harvest methods, clearcutting (CC) and seed tree cut (STC). In regeneration methods, planting (PL), natural regeneration under seed tree (NRST), and natural regeneration (NR). MIC were grouped into: High, Low, Medium Intensity, No Investment, and No Management. Moderate Intensity is a combined MICs for spatial distribution and visualization purpose used in Fig. 8. | ||||
| Name of the aggregate of Management Intensity Class (MIC) | Harvest methods | Regeneration methods | ||
| Pine | Spruce | Broadleaves | ||
| High Intensity | CC, STC, Thinning | PL, NRST | PL | NR |
| Medium Intensity | CC, STC, Thinning | NRST | PL | NR |
| Low Intensity | CC, STC, Thinning | None | PL | NR |
| No Investment | CC, STC, Thinning | None | None | NR |
| No Management | None | None | None | None |
| Moderate Intensity (combined MIC which includes Medium, Low, and No Investment) | CC, STC, Thinning | PL, NRST | PL | NR |
| Table 2. Overview of policy scenarios analyzed in the study: business-as-usual (BAU), carbon policy (Carb), biodiversity policy (Bio), and their combination (BioCarb). BAU scenario reflects a continuation of trends observed at the time of the study, while the Bio scenario introduces a policy of harvest restrictions of forests containing certain broadleaves and old forests. The Carb scenario implements taxes/subsidies for carbon fluxes based on a carbon price of 100 € MgCO2eq–1. In the BioCarb scenario, biodiversity and carbon policies are combined. Maps of spatial distribution of target tree species described under Bio scenario are provided in Supplementary file S1. | |
| Scenario | Description |
| BAU | Business-as-usual with policies continuing as observed during the study period with no new policies implemented. |
| Bio | Biodiversity policy based on three plot features: Warm broadleaves: harvest does not occur if there is at least one of the following warm broadleaves (Fjellstad and Skrøppa 2020) species present in the plot: lime (Tilia cordata Mill.), common ash (Fraxinus excelsior L.), oaks (Quercus robur L., Quercus petraea (Matt.) Liebl.), European beech (Fagus sylvatica L.), common alm (Ulmus glabra Mill.), Norway maple (Acer platanoides L.), sweet cherry (Prunus avium (L.) L.). Ungulate forage: maximum national, total removal for rowan (Sorbus aucuparia L.), aspen (Populus tremula L.), and great sallow (Salix caprea L.) is 250 000 m3 yr –1 , about halve the base harvest level. Old forest: harvest does not occur if the stand age is equal to or greater than 160 years. |
| Carb | All carbon fluxes subject to tax/subsidies of 100 € Mg CO2eq–1. |
| BioCarb | Combined Bio policy and Carb policy. |
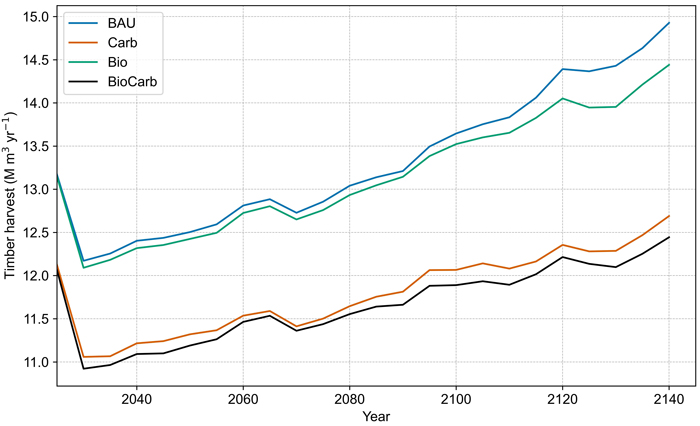
Fig. 2. Estimated total timber harvest expressed in million cubic meters per year (M m3 yr–1) from 2025 to 2140 under four different management scenarios. Business-as-usual (BAU) carbon policy (Carb) biodiversity policy (Bio), and their combination (BioCarb).
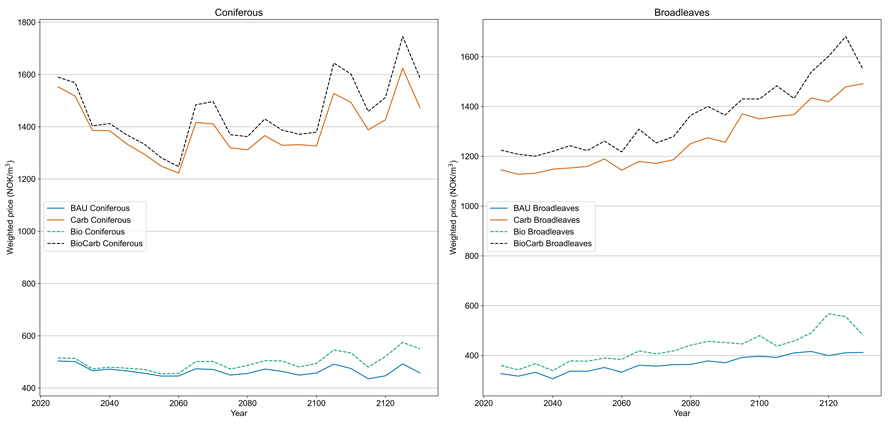
Fig. 3. Weighted timber price expressed in Norwegian Kroner (NOK) per cubic meter (1 NOK equal about 0.086 € in July 2024). Left: weighted timber prices of coniferous pulpwood and saw logs. Right: weighted timber prices of pulpwood and saw logs of broadleaves. Scenarios are business-as-usual (BAU), carbon policy (Carb), biodiversity policy (Bio), and their combination (BioCarb). View larger in new window/tab.
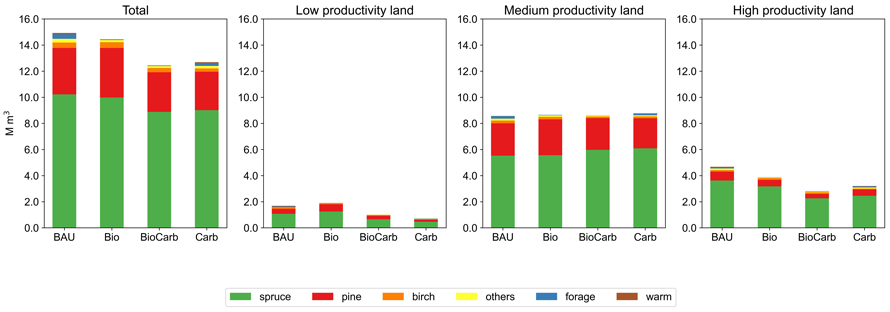
Fig. 4. Timber harvest per tree species group expressed in million m3, total and divided into land productivity levels (site index) for all scenarios. Six tree species group: spruce, birch, pine, temperate broadleaves (warm), ungulated forage (forage), and others (all other tree species). Scenarios are business-as-usual (BAU), carbon policy (Carb), biodiversity policy (Bio), and their combination (BioCarb). View larger in new window/tab.
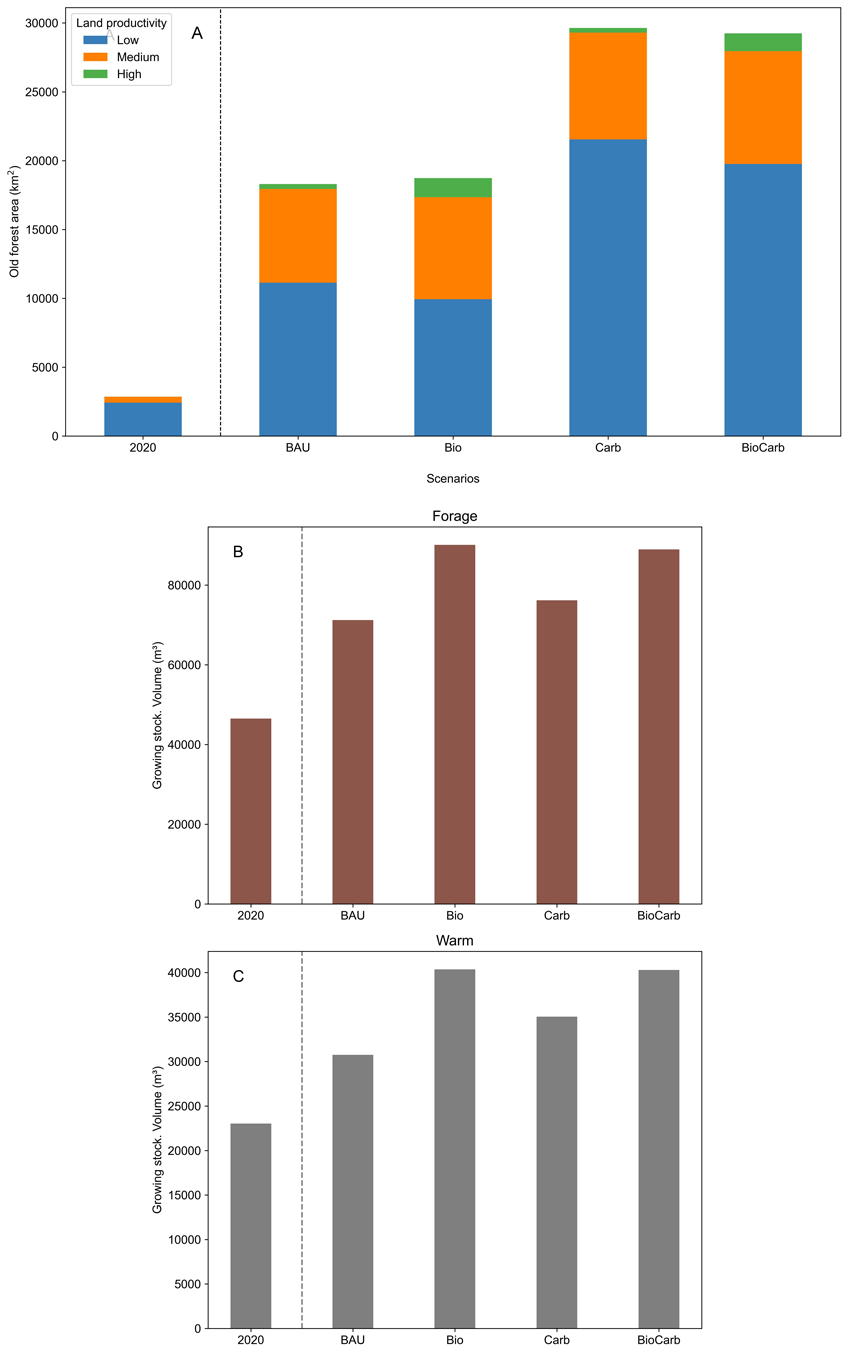
Fig. 5. Biodiversity attributes in 2020 and in 2140. A: Total old forest area (stand age equal to or greater than 160 years) in square kilometer (km2) for three land productivity levels (sites index levels). B: Growing stock volume in m3 of forage (ungulate forage) tree species. C: Growing stock volume in m3 of warm tree species (temperate broadleaves). Scenarios are business-as-usual (BAU), carbon policy (Carb), biodiversity policy (Bio), and their combination (BioCarb).
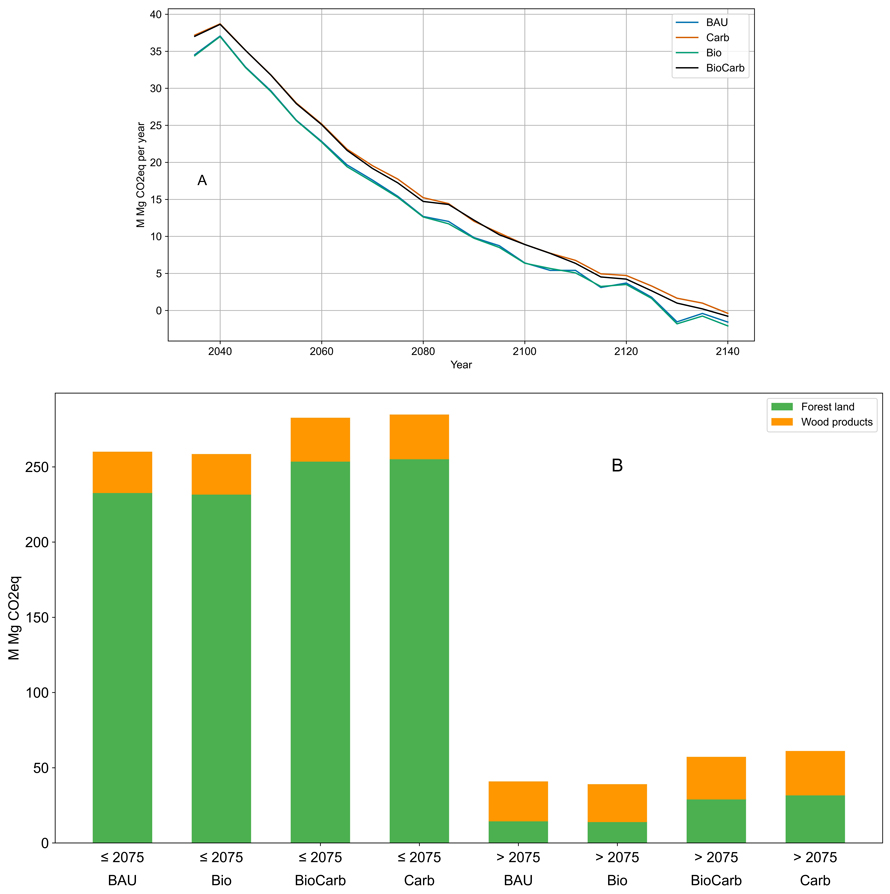
Fig. 6. A: Overall net greenhouse gas (GHG) fluxes of the Norwegian forest sector in the 2025–2140 period, expressed in million megagram of CO2equivalents per year (M Mg CO2eq yr–1). B: Overall net GHG fluxes divided into Forest land (living and dead wood and soil) and Wood products (harvesting, processing, and use of wood products) summed for two periods: up to 2075 and beyond 2075. Positive numbers are net sequestration. Scenarios are business-as-usual (BAU), carbon policy (Carb), biodiversity policy (Bio), and their combination (BioCarb).
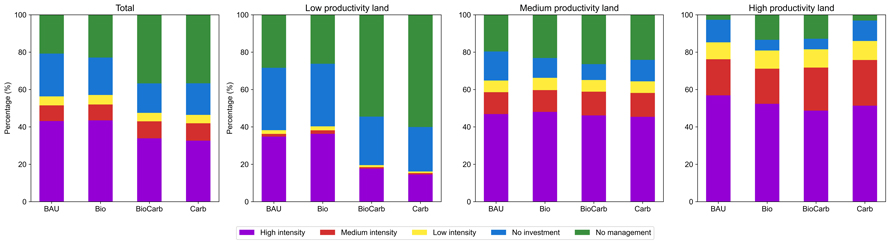
Fig. 7. Five different forest management intensity alternatives: High Intensity, Medium Intensity, Low Intensity, No Investment, and No Management expressed in percentage of total productive forest land, and grouped by low, medium, and high productivity land (site index levels). Scenarios are business-as-usual (BAU), carbon policy (Carb), biodiversity policy (Bio), and their combination (BioCarb). View larger in new window/tab.
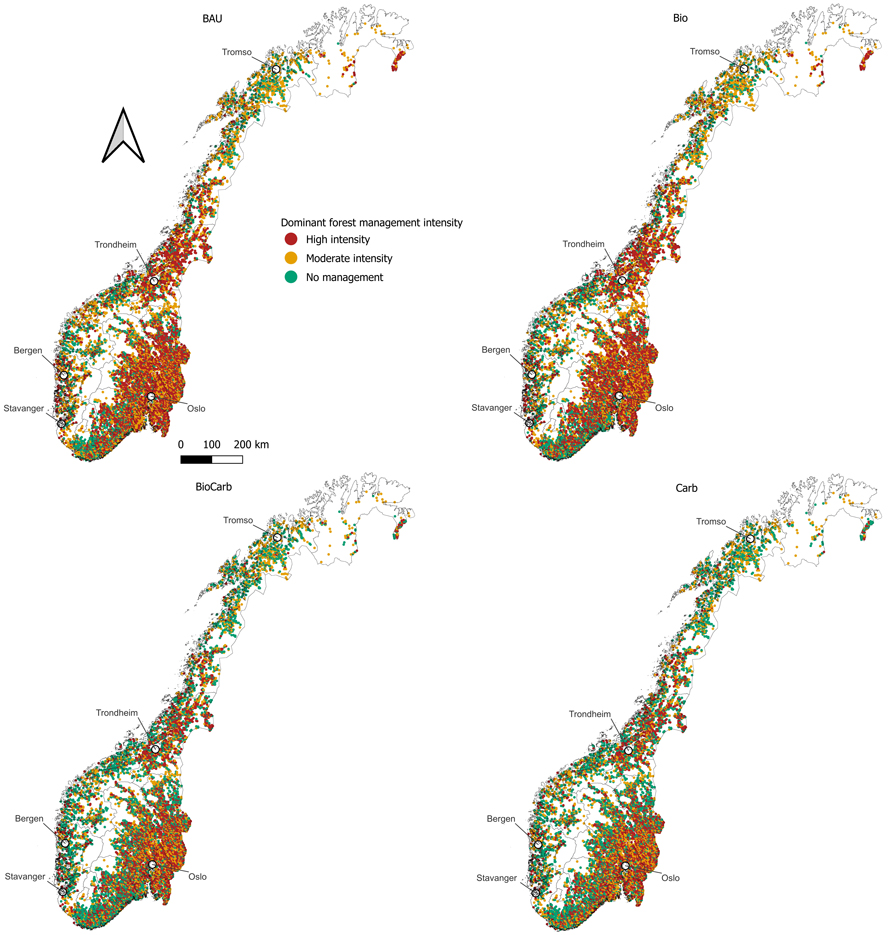
Fig. 8. Spatial distribution of predominant forest management intensities in productive forest in Norway. Scenarios are business-as-usual (BAU), carbon policy (Carb), biodiversity policy (Bio), and their combination (BioCarb). View larger in new window/tab.