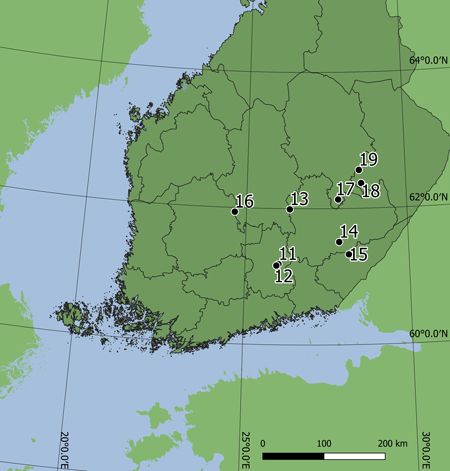
Fig. 1. Locations of nine stands used to study the early development of spruce-birch mixtures. The coordinates of stands varied between 61.162451°–62.56185° north and 24.63745°–28.59488° east. Two plots of 500 m2 were measured in each stand. Stand characteristics are described in Tables 1 and 2.
| Table 1. Basic site information of nine stands used to study the early development of spruce-birch mixtures. Age is time since planting, TS is temperature sum in degree days (dd), EC is early cleaning, and C/N organic and mineral are carbon-nitrate ratio in different layers of soil. Thickness of organic layer is mean thickness of all samples from each stand. | |||||||||
| Stand | Age, years | Planting year | EC year | Site type | TS, dd | Municipality | C/N organic | C/N mineral | Thickness of organic layer, mm |
| 10 | 8 | 2013 | 2017 | OMT | 1371 | Heinola | 23.8 | 21.5 | 8 |
| 12 | 10 | 2011 | 2015 | OMT | 1371 | Heinola | 25.3 | 23.3 | 11 |
| 13 | 9 | 2012 | 2016 | MT | 1235 | Joutsa | 27.6 | 27.1 | 20 |
| 14 | 8 | 2013 | 2017 | MT | 1383 | Puumala | 23.3 | 21.8 | 21 |
| 15 | 8 | 2013 | 2017 | MT | 1403 | Taipalsaari | 19.7 | 19.3 | 23 |
| 16 | 11 | 2010 | 2015 | MT | 1243 | Jämsä | 30.5 | 23.9 | 33 |
| 17 | 14 | 2007 | 2016 | MT | 1256 | Joroinen | 19.8 | 19.6 | 16 |
| 18 | 12 | 2009 | 2016 | MT | 1287 | Heinävesi | 27.4 | 24.9 | 33 |
| 19 | 14 | 2007 | 2014 | MT | 1260 | Leppävirta | 28.8 | 24.3 | 49 |
| Table 2. Characteristics of nine stands used to study the early development of spruce-birch mixtures by tree species and origin. | ||||||||
| Stand | Species | Origin | Stem number, ha−1 | % of stems | Basal area, m2 ha−1 | Mean DBH, cm | Mean height, m | Dominant height, m |
| 11 | all | all | 2930 | 100% | 0.90 | 1.7 | 2.5 | 3.7 |
| Scots pine | seed | 80 | 3% | 0.06 | 2.6 | 2.6 | 3.0 | |
| Norway spruce | planted | 1810 | 62% | 0.56 | 1.8 | 2.2 | 3.4 | |
| Silver birch | seed | 790 | 27% | 0.22 | 1.6 | 2.9 | 4.7 | |
| Silver birch | sprout | 70 | 2% | 0.01 | 1.3 | 2.8 | 3.0 | |
| Downy birch | seed | 170 | 6% | 0.07 | 2.0 | 3.5 | 4.6 | |
| Downy birch | sprout | 10 | 0% | 0 | 1.0 | 2.6 | 2.6 | |
| 12 | all | all | 3320 | 100% | 3.80 | 3.6 | 3.9 | 5.1 |
| Scots pine | seed | 490 | 15% | 0.98 | 4.7 | 3.7 | 5.3 | |
| Norway spruce | planted | 1750 | 53% | 2.29 | 3.9 | 3.8 | 5.8 | |
| Silver birch | seed | 360 | 11% | 0.17 | 2.3 | 3.9 | 5.0 | |
| Silver birch | sprout | 270 | 8% | 0.14 | 2.5 | 4.1 | 4.8 | |
| Downy birch | seed | 130 | 4% | 0.10 | 2.9 | 4.4 | 5.0 | |
| Downy birch | sprout | 320 | 10% | 0.15 | 2.3 | 4.3 | 5.2 | |
| 13 | all | all | 3180 | 100% | 1.02 | 1.7 | 2.6 | 5.1 |
| Scots pine | seed | 60 | 2% | 0.01 | 1.3 | 1.9 | 1.9 | |
| Norway spruce | planted | 1980 | 62% | 0.74 | 1.9 | 2.5 | 4.7 | |
| Silver birch | seed | 240 | 8% | 0.07 | 1.6 | 2.9 | 4.1 | |
| Silver birch | sprout | 660 | 21% | 0.11 | 1.2 | 2.7 | 3.8 | |
| Downy birch | seed | 130 | 4% | 0.08 | 2.2 | 3.4 | 5.2 | |
| Downy birch | sprout | 110 | 3% | 0.01 | 1.1 | 2.7 | 3.0 | |
| 14 | all | all | 3230 | 100% | 1.60 | 2.1 | 2.9 | 5.6 |
| Scots pine | seed | 130 | 4% | 0.09 | 2.8 | 2.6 | 3.1 | |
| Norway spruce | planted | 1760 | 54% | 1.12 | 2.6 | 2.9 | 5.3 | |
| Silver birch | seed | 1070 | 33% | 0.35 | 1.6 | 3.1 | 6.6 | |
| Silver birch | sprout | 220 | 7% | 0.02 | 0.9 | 2.5 | 3.0 | |
| Downy birch | seed | 40 | 1% | 0.02 | 2.0 | 3.6 | 3.6 | |
| Downy birch | sprout | 10 | 0% | 0.01 | 2.1 | 4.5 | 4.5 | |
| 15 | all | all | 3920 | 100% | 2.63 | 2.6 | 3.5 | 5.5 |
| Scots pine | seed | 260 | 7% | 0.49 | 4.4 | 3.3 | 4.8 | |
| Norway spruce | planted | 1840 | 47% | 1.40 | 3.0 | 3.2 | 6.2 | |
| Silver birch | seed | 1130 | 29% | 0.54 | 2.1 | 3.9 | 7.5 | |
| Silver birch | sprout | 510 | 13% | 0.13 | 1.7 | 3.5 | 5.2 | |
| Downy birch | seed | 80 | 2% | 0.05 | 2.6 | 4.9 | 5.1 | |
| Downy birch | sprout | 100 | 3% | 0.03 | 1.7 | 3.8 | 4.5 | |
| 16 | all | all | 3040 | 100% | 3.78 | 3.4 | 3.5 | 5.8 |
| Scots pine | seed | 110 | 4% | 0.10 | 3.0 | 2.5 | 3.1 | |
| Norway spruce | planted | 1950 | 64% | 3.52 | 4.5 | 3.8 | 6.5 | |
| Silver birch | seed | 20 | 1% | 0.01 | 2.2 | 3.9 | 3.9 | |
| Silver birch | sprout | 900 | 30% | 0.13 | 1.3 | 3 | 4.0 | |
| Downy birch | seed | 20 | 1% | 0.02 | 3.4 | 4.9 | 4.9 | |
| Downy birch | sprout | 40 | 1% | 0.01 | 1.5 | 2.8 | 2.8 | |
| 17 | all | all | 2790 | 100% | 4.77 | 4.0 | 4.5 | 9.5 |
| Scots pine | seed | 0 | 0% | 0 | 0 | 0 | 0 | |
| Norway spruce | planted | 1380 | 49% | 3.18 | 5.0 | 4.3 | 7.6 | |
| Silver birch | seed | 220 | 8% | 0.39 | 3.5 | 5.2 | 9.4 | |
| Silver birch | sprout | 320 | 11% | 0.17 | 2.0 | 3.9 | 5.8 | |
| Downy birch | seed | 470 | 17% | 0.75 | 3.9 | 5.4 | 9.5 | |
| Downy birch | sprout | 400 | 14% | 0.29 | 2.4 | 4.1 | 7.4 | |
| 18 | all | all | 2350 | 100% | 5.98 | 5.3 | 5.5 | 7.7 |
| Scots pine | seed | 110 | 5% | 0.24 | 4.8 | 3.9 | 4.8 | |
| Norway spruce | planted | 1400 | 60% | 4.62 | 6.4 | 5.7 | 6.9 | |
| Silver birch | seed | 210 | 9% | 0.52 | 5.2 | 6.8 | 8.5 | |
| Silver birch | sprout | 390 | 17% | 0.45 | 3.4 | 5.2 | 8.2 | |
| Downy birch | seed | 100 | 4% | 0.08 | 3.0 | 4.9 | 5.9 | |
| Downy birch | sprout | 140 | 6% | 0.09 | 2.6 | 4.5 | 5.5 | |
| 19 | all | all | 2340 | 100% | 4.54 | 4.6 | 4.7 | 7.3 |
| Scots pine | seed | 120 | 5% | 0.49 | 6.9 | 4.8 | 5.3 | |
| Norway spruce | planted | 1460 | 62% | 3.61 | 5.5 | 4.9 | 7.5 | |
| Silver birch | seed | 170 | 7% | 0.09 | 2.5 | 4.3 | 5.0 | |
| Silver birch | sprout | 220 | 9% | 0.18 | 3.0 | 4.6 | 6.4 | |
| Downy birch | seed | 120 | 5% | 0.08 | 2.7 | 4.7 | 5.4 | |
| Downy birch | sprout | 250 | 11% | 0.11 | 2.3 | 4.1 | 4.6 | |
| Table 3. Mean values (mean) and standard deviations (SD) of the plot-level variables of crop trees by tree species and origin on 18 sample plots in 9 stands. Data for the same variable marked with different letters are significantly different (p < 0.05). The significance of tree species, origin effect and stand effect was tested by the analysis of variance. | |||||||||
| Spruce | Silver birch | Downy birch | Effect of species and origin | Effect of stand | |||||
| planted | seed | sprout | seed | sprout | F | p | F | p | |
| Variable | Mean ± SD | Mean ± SD | Mean ± SD | Mean ± SD | Mean ± SD | ||||
| Mean DBH, cm | 3.80 ± 1.72a | 2.37 ± 1.44bc | 1.87 ± 0.85bc | 2.54 ± 1.27b | 1.47 ± 0.96c | 14.09 | <0.001 | 8.02 | <0.001 |
| Mean height, m | 3.67 ± 1.2a | 3.89 ± 1.64a | 3.56 ± 0.95a | 4 ±1.69a | 2.87 ± 1.71a | 2.36 | 0.060 | 5.77 | <0.001 |
| Dominant height, m | 5.31 ± 1.52a | 5.12 ± 2.18a | 4.33 ± 1.52ab | 4.46 ±2.17ab | 3.3 ± 2.13b | 4.60 | 0.002 | 6.37 | <0.001 |
| Basal area, m2 ha−1 | 2.32 ± 1.69a | 0.26 ± 0.24b | 0.15 ± 0.14b | 0.13 ± 0.23b | 0.07 ± 0.11b | 31.35 | <0.001 | 2.20 | 0.036 |
| Stem number, ha−1 | 1646 ± 291a | 468 ± 426b | 393 ± 289bc | 140 ±148c | 153 ± 164c | 87.49 | <0.001 | 0.94 | 0.489 |
| Volume, m3 ha−1 | 7.32 ± 5.8a | 0.92 ± 0.95b | 0.49 ± 0.49b | 0.48 ±0.89b | 0.24 ± 0.39b | 26.46 | <0.001 | 2.42 | 0.022 |
| Table 4. Mean values (mean) and standard deviations (SD) of the tree-level variables of the sample trees by tree species and origin. Data for the same variable marked with different letters are significantly different (p < 0.05). F-test based on estimated marginal means shows the significance of the fixed effects of tree species and origin in the mixed effect models estimated for the given variable. DSH = diameter at stump height, iDSH = increment of diameter at stump height, ih = height increment. | |||||||
| Variable | Spruce | Silver birch | Downy birch | F | p | ||
| Planted | Seed | Sprout | Seed | Sprout | |||
| Mean ± SD | Mean ± SD | Mean ± SD | Mean ± SD | Mean ± SD | |||
| All sample trees | N = 136 | N = 55 | N = 42 | N = 25 | N = 16 | 45.20 | <0.001 |
| Age (years) | 9.1 ± 2.0a | 7.5 ± 2.0bc | 5.3 ± 3.3d | 8.3 ± 1.8ab | 6.7 ± 3.3cd | 27.87 | <0.001 |
| DSH (mm) | 48.2 ± 21.5a | 36.9 ± 15.0bc | 34.4 ± 16.9d | 43.7 ± 18.7ab | 26.1 ± 17.8cd | 13.67 | <0.001 |
| Height (cm) | 341 ± 148a | 432 ± 139b | 341 ± 148a | 459 ± 135b | 345 ± 150a | 3.85 | 0.005 |
| Mean iDSH in the last 4 years (mm) | 6.9 ± 2.7a | 6.3 ± 2.6a | 5.7 ± 2.4a | 6.9 ± 3.1b | 5.1 ± 1.8c | 16.34 | <0.001 |
| Mean ih in the last 4 years (cm) | 45.8 ± 17.5ab | 57.7 ± 11.1a | 55 ± 13.5a | 61.1 ± 14.6a | 54.1 ± 12.8b | ||
| Dominant sample trees | N = 73 | N = 42 | N = 22 | N = 23 | N = 12 | ||
| Age (years) | 9.3 ± 2.0a | 7.6 ± 2.1b | 5.8 ± 3.3c | 8.4 ± 1.8ab | 6.9 ± 3.4bc | 24.46 | <0.001 |
| DSH (mm) | 55.8 ± 23.4a | 40.9 ± 15.5b | 29.0 ± 18.5b | 44.1 ± 19.2a | 31.3 ± 18.7ab | 22.76 | <0.001 |
| Height (cm) | 379 ± 160a | 453 ± 137b | 380 ± 149ab | 455 ± 126b | 365 ± 135ab | 6.03 | <0.001 |
| Mean iDSH in the last 4 years (mm) | 7.9 ± 2.9a | 6.9 ± 2.6ab | 6.7 ± 2.4ab | 6.9 ± 3.2ab | 5.8 ± 2.0b | 3.34 | 0.012 |
| Mean ih in the last 4 years (cm) | 49.8 ± 18.5a | 59.4 ± 11.2b | 57.2 ± 14.6ab | 60.8 ± 14.9b | 57.2 ± 13.0ab | 6.06 | <0.001 |
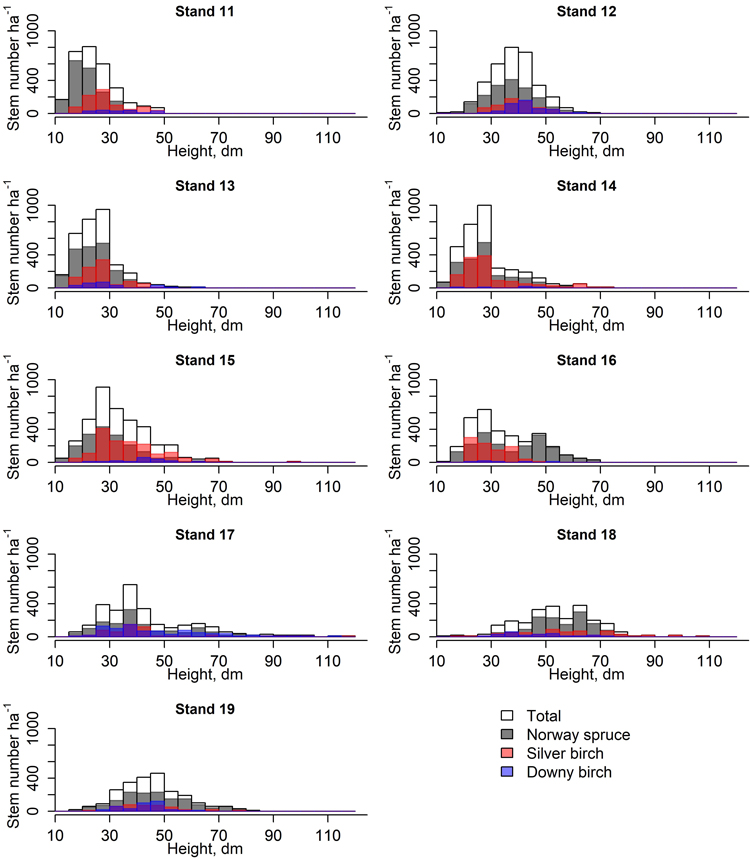
Fig. 2. Height class distribution (5 dm) of spruces and birches in nine stands used to study the early development of spruce-birch mixtures.
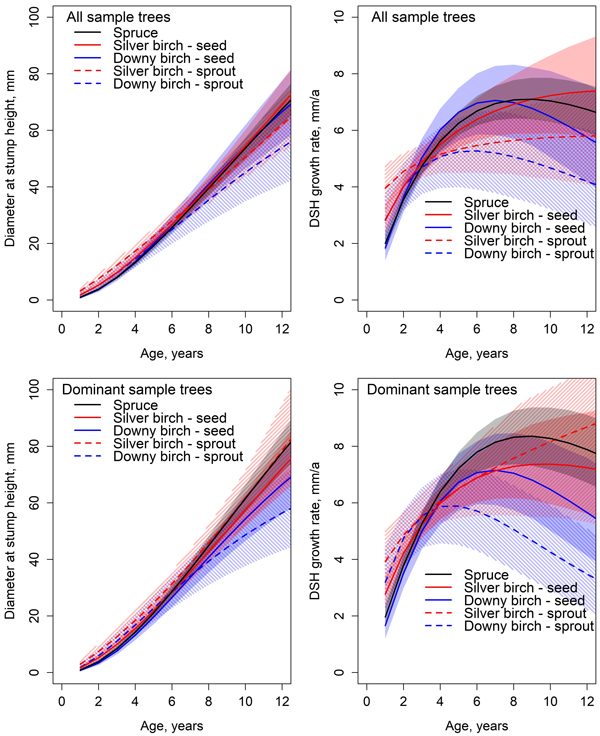
Fig. 3. Predicted development and absolute growth rate of diameter at stump height (DSH) based on the Chapman-Richards type growth models fitted for all sample trees and dominant sample trees. Colored areas indicate 95% confidence bands derived from the estimates and standard errors of the fixed parameters (Table 5). The mean value of C/N ratio in organic layer (25.5) was used in predictions.
| Table 5. Chapman-Richards models (Eq. 1) for under-bark diameter at stump height of all sample trees (8 spruces and 8 birches per plot) and dominant sample trees (4 thickest trees per species and plot). Fitting statistics using only fixed effects are also given. Note: Planted Norway spruce was used as reference. | |||||
| All sample trees | Dominant sample trees | ||||
| Estimate | S.E. | Estimate | S.E. | ||
| Fixed parameter (species) | |||||
| β1 (all species) | 84.5496 | 7.8833 | 111.1110 | 10.4781 | |
| β1 (silver birch, seed-origin) | 0.7415ns | 2.9090 | −4.0413ns | 3.2554 | |
| β1 (downy birch, seed-origin) | 0.6440ns | 3.9894 | −7.1718ns | 4.0967 | |
| β1 (silver birch, sprout-origin) | −3.2092ns | 3.6216 | 0.0857ns | 4.8827 | |
| β1 (downy birch, sprout-origin) | −8.5849ns | 5.0510 | −12.8707 | 5.3436 | |
| β1,C/N organic (all species) | −1.2090 | 0.3019 | −1.9427 | 0.4019 | |
| β2 (all species) | 0.0791 | 0.0048 | 0.0870 | 0.0061 | |
| β2 (silver birch, seed-origin) | −0.0456 | 0.0140 | −0.0309ns | 0.0160 | |
| β2 (downy birch, seed-origin) | 0.0373ns | 0.0198 | 0.0391 | 0.0199 | |
| β2 (silver birch, sprout-origin) | −0.0645 | 0.0168 | −0.0899 | 0.0223 | |
| β2 (downy birch, sprout-origin) | 0.0109ns | 0.0214 | 0.0476 | 0.0222 | |
| β3 (all species) | 1.9984 | 0.0671 | 2.1430 | 0.0900 | |
| β3 (silver birch, seed-origin) | −0.4216 | 0.0940 | −0.4251 | 0.1204 | |
| β3 (downy birch, seed-origin) | 0.2601ns | 0.1766 | 0.2427ns | 0.1903 | |
| β3 (silver birch, sprout-origin) | −0.7730 | 0.0975 | −0.8384 | 0.1378 | |
| β3 (downy birch, sprout-origin) | −0.3200ns | 0.1708 | −0.2966ns | 0.1974 | |
| Random parameters | |||||
| Stand level | sd(β1,k) | -- | corr(β1,k, β3,k) | -- | corr(β1,k, β3,k) |
| sd(β3,k) | -- | -- | -- | -- | |
| Plot level | sd(β1,jk) | 5.6840 | corr(β1,jk, β3,jk) | 7.7010 | corr(β1,jk, β3,jk) |
| sd(β3,jk) | 0.1939 | 0.894 | 0.2376 | 0.877 | |
| Tree level | sd(β1,ijk) | 16.6163 | corr(β1,ijk, β3,ijk) | 14.9734 | corr(β1,ijk, β3,ijk) |
| sd(β3,ijk) | 0.3897 | 0.313 | 1.7595 | 0.264 | |
| Error term | sd(eijk) (spruce) | 1.6002 | 1.7424a | ||
| sd(eijk) (silver birch) | 1.4985 | 1.6261a | |||
| sd(eijk) (downy birch) | 1.9117 | 1.7595a | |||
| Fitting statistics | Random + fixed | Fixed only | Random + fixed | Fixed only | |
| R2 | 99.4% | 77.4% | 99.5% | 82.4% | |
| Bias, mm (Bias%) | 0.02 (0.1%) | −0.11 (−0.5%) | 0.03 (0.1%) | −0.16 (−0.6%) | |
| RMSE, mm (RMSE%) | 1.40 (6.1%) | 8.84 (38.3%) | 1.48 (5.8%) | 8.60 (33.6%) | |
| ns Non-significant at 0.05. a Based on the likelihood-ratio test, the model estimated with different relative variance weights for each tree species was not significantly better than the one assuming homogeneity of variances. | |||||
| Table 6. Chapman-Richards models (Eq. 1) for height of all sample trees (8 spruces and 8 birches per plot) and dominant sample trees (4 thickest trees per species and plot). Fitting statistics using only fixed effects are also given. Note: Planted Norway spruce was used as reference. | ||||
| All sample trees | Dominant sample trees | |||
| Estimate | S.E. | Estimate | S.E. | |
| Fixed parameter (species) | ||||
| β1 (all species) | 716.1577 | 93.2797 | 833.3473 | 111.0242 |
| β1 (silver birch, seed-origin) | 192.5226 | 21.3071 | 172.7279 | 25.3613 |
| β1 (downy birch, seed-origin) | 193.3425 | 29.3316 | 155.9348 | 32.1360 |
| β1 (silver birch, sprout-origin) | 203.5790 | 26.4137 | 212.1720 | 35.7630 |
| β1 (downy birch, sprout-origin) | 147.2801 | 37.8146 | 117.1191 | 43.1173 |
| β1,C/N organic (all species) | −13.6956 | 3.6286 | −16.5793 | 4.3262 |
| β2 (all species) | −0.0741 | 0.0065 | −0.0747 | 0.0085 |
| β2 (silver birch, seed-origin) | −0.0092ns | 0.0197 | −0.0475ns | 0.0251 |
| β2 (downy birch, seed-origin) | −0.1350 | 0.0351 | −0.1878 | 0.0434 |
| β2 (silver birch, sprout-origin) | −0.0689 | 0.0249 | −0.1002 | 0.0347 |
| β2 (downy birch, sprout-origin) | −0.1438 | 0.0419 | −0.1236 | 0.0474 |
| β3 (all species) | 1.0550 | 0.0407 | 1.0390 | 0.0423 |
| β3 (silver birch, seed-origin) | −0.3110 | 0.0520 | −0.3786 | 0.0555 |
| β3 (downy birch, seed-origin) | −0.4628 | 0.0685 | −0.5092 | 0.0673 |
| β3 (silver birch, sprout-origin) | −0.4500 | 0.0565 | −0.4942 | 0.0648 |
| β3 (downy birch, sprout-origin) | −0.5940 | 0.0774 | −0.5385 | 0.0806 |
| Random parameters | ||||
| Stand level | ||||
| sd(β1,k) | 34.8201 | corr(β1,k, β3,k) | 17.8919 | corr(β1,k, β3,k) |
| sd(β3,k) | 0.0759 | −0.166 | 0.0726 | −0.960 |
| Plot level | ||||
| sd(β1,jk) | 42.6272 | corr(β1, jk, β3,jk) | 58.9656 | corr(β1, jk, β3,jk) |
| sd(β3,jk) | 0.0634 | 0.970 | 0.0321 | 0.748 |
| Tree level | ||||
| sd(β1,ijk) | 116.1489 | corr(β1,ijk, β3,ijk) | 111.1361 | corr(β1,ijk, β3,ijk) |
| sd(β3,ijk) | 0.2177 | −0.312 | 0.1675 | −0.204 |
| Error term | ||||
| sd(eijk) (spruce) | 11.9095 | 12.9492 | ||
| sd(eijk) (silver birch) | 22.2558 | 24.2960 | ||
| sd(eijk) (downy birch) | 21.7166 | 22.1014 | ||
| Fitting statistics | Random + fixed | Fixed only | Random + fixed | Fixed only |
| R2 | 98.9% | 65.1% | 98.8% | 69.1% |
| Bias, mm (Bias%) | −0.17 (−0.1%) | 2.13 (1.0%) | −0.23 (−0.1%) | −1.62 (−0.7%) |
| RMSE, mm (RMSE%) | 15.14 (7.0%) | 87.19 (40.9%) | 17.02 (7.2%) | 85.58 (36.0%) |
| ns Non-significant at 0.05. a Based on the likelihood-ratio test, the model estimated with different relative variance weights for each tree species was not significantly better than the one assuming homogeneity of variances. | ||||
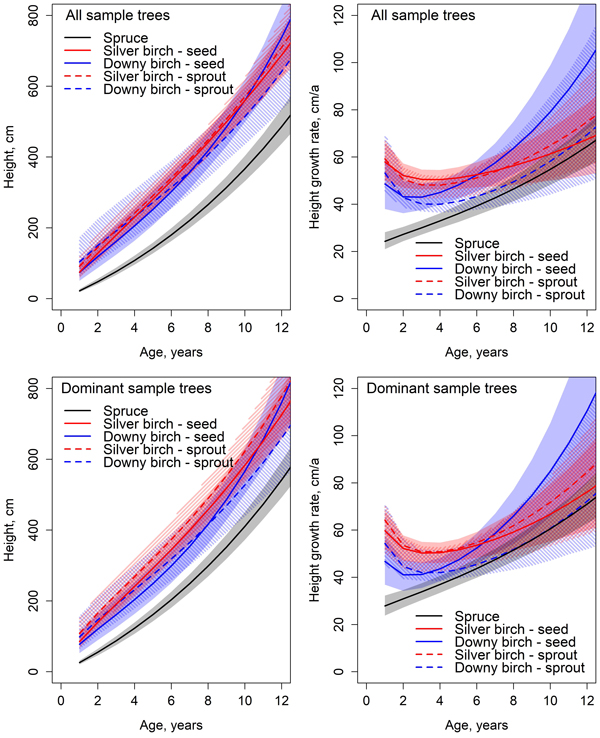
Fig. 4. Predicted development and absolute growth rate of height based on the Chapman-Richards type growth models fitted for all sample trees and dominant trees. Colored areas indicate 95% confidence bands derived from the estimates and standard errors of the fixed parameters (Table 6). The mean value of C/N ratio in organic layer (25.5) was used in predictions.
| Table 7. Statistically significant differences (p < 0.05) among the species- and origin-specific fixed parameters of Chapman-Richards models (Eq. 1) for under-bark diameter at stump height and height of all sample trees (8 spruces and 8 birches per plot) and dominant sample trees (4 thickest trees per species and plot). Parameter estimates for the same model and parameter marked with different letters are significantly different (p < 0.05). | |||||||
| Model for | Spruce | Silver birch, seed-origin | Downy birch, seed-origin | Silver birch, sprout-origin | Downy birch, sprout-origin | ||
| Diameter at stump height | All sample trees | β1 | a | a | a | a | a |
| β2 | a | b | a | b | a | ||
| β3 | ab | c | b | d | ac | ||
| Dominant sample trees | β1 | a | ab | ac | ad | bcd | |
| β2 | a | a | b | c | b | ||
| β3 | ab | c | b | d | ac | ||
| Height | All sample trees | β1 | a | b | b | b | b |
| β2 | a | a | b | b | b | ||
| β3 | a | b | c | c | c | ||
| Dominant sample trees | β1 | a | b | b | b | b | |
| β2 | a | a | bc | ab | ac | ||
| β3 | a | b | b | b | b | ||
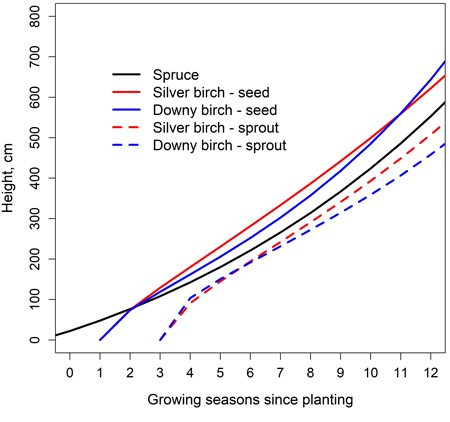
Fig. 5. Simulated height development of Norway spruce, silver birch and downy birch in a mixed spruce-birch stand (Eq. 1, Table 6); carbon-nitrogen ratio of 25.5 was used. Spruce is planted, and birches regenerate naturally from seeds and sprouts. EC is performed at the beginning of 4th growing season after spruce planting.
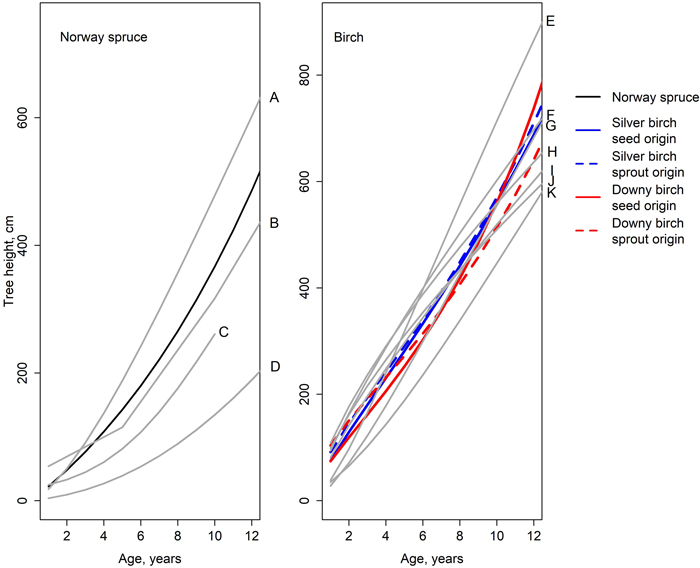
Fig. 6. Height developments simulated by the models of this study (Eq. 1, Table 6); the earlier studies are illustrated with gray lines. A = spruce in a mixed spruce-birch stand (Huuskonen et al. 2023), B = spruce in a pure spruce stand on fresh site (Siipilehto et al. 2014), C = spruce in a pure spruce stand (Saksa et al. 2005), D = spruce in a pure spruce stand (Elfving 1982), E = silver birch in a mixed spruce-birch stand (Huuskonen et al. 2023), F = sprout-origin silver birch, stump diameter 5 cm (Björkdahl 1983), G = downy birch in a mixed spruce-birch stand (Huuskonen et al. 2023), H = sprout-origin downy birch, stump diameter 5 cm (Björkdahl 1983), I = sprout-origin silver birch, stump diameter 2.5 cm (Björkdahl 1983), J = sprout-origin downy birch, stump diameter 2.5 cm (Björkdahl 1983), and K = seed-origin birch (Elfving 1982).
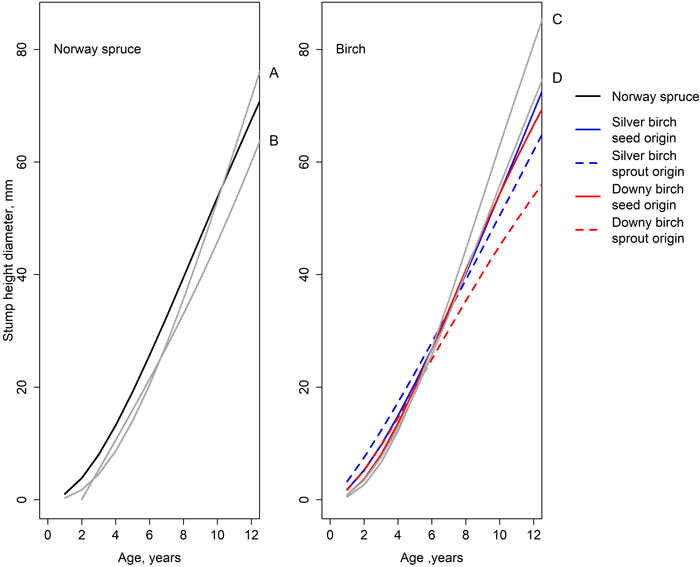
Fig. 7. Development of stump height diameter simulated by the models of this study (Eq. 1, Table 5) and earlier studies: A = spruce in a mixed spruce-birch stand (Huuskonen et al. 2023), B = spruce in a mixed pine-spruce stand (Bianchi et al. 2021), C = silver birch in a mixed spruce-birch stand (Huuskonen et al. 2023), and D = downy birch in a mixed spruce-birch stand (Huuskonen et al. 2023).
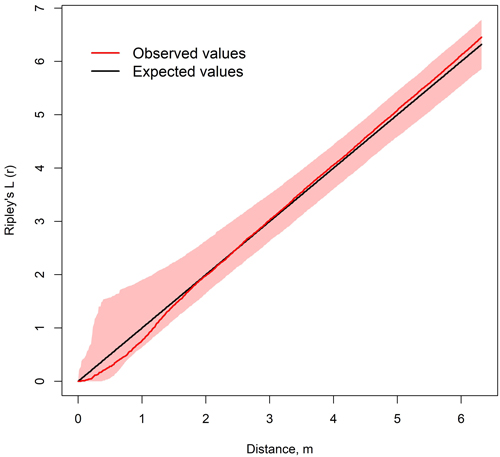
Fig. 8. Average of Ripley’s L12-functions of spruce and birch on 18 sample plots in nine mixed spruce-birch stands. Colored area represents the confidence level of 999 Montecarlo simulations.