| Table 1. List of publications and studied tree species used for the meta-analyses, assessing effect sizes of moose exclusion on seedling density and height. Abbreviations for tree genera or species refer to Table 2. | ||||
| Author(s) | Year | Tree genus or species used in the analyses | Location | |
| 1 | Angell & Kielland | 2009 | SALIX | Alaska, USA |
| 2 | Faison et al. | 2016 | DECID | Massachusetts, USA |
| 3 | Heikkilä et al. | 2003 | BETULA, PICEA, PINSYL, SALIX, SORBUS | C Finland |
| 4 | Heikkilä & Tuominen | 2009 | BETULA, PICEA, PINSYL, POPTRE | S Finland |
| 5 | Hidding et al. | 2013 | ABIBAL, BETULA, PICEA, POPTRE, PRUPEN | Quebec, CAN |
| 6 | Jensen et al. | 2012 | QUERCUS | S Sweden |
| 7 | Kielland & Bryant | 1998 | SALIX | Alaska, USA |
| 8 | Kolstad et al. | 2018 | BETULA, PICEA, PINSYL, SORBUS | S and C Norway |
| 9 | Leonardson et al. | 2015 | CONIFER | S Sweden |
| 10 | Nes | 2015 | ABIBAL, BETULA, PICEA, PINSYL, SORBUS | Quebec, CAN, S and C Norway |
| 11 | Nosko et al. | 2020 | ABIBAL | Newfoundland, CAN |
| 12 | Siipilehto & Heikkilä | 2005 | PINSYL | C Finland |
| 13 | Speed et al. | 2013 | BETULA, PICEA, PINSYL, POPTRE, SALIX, SORBUS | S and C Norway |
| 14 | Thompson et al. | 1992 | ABIBAL, BETULA, POPTRE, PRUPEN | Newfoundland, CAN |
| Table 2. Abbreviations of the tree species or genera used in the meta-analyses, assessing effect sizes of moose exclusion on seedling density and height, and sources (referring to Table 1) for analyses of density or height, respectively. | ||||
| Abbreviation | Tree species | Density | Height | |
| 1 | ABIBAL | Abies balsamea (L.) Mill. | 5, 10, 14 | 5, 11, 14 |
| 2 | BETULA | Betula papyrifera Marshall | 5, 10, 14 | 5, 14 |
| 3 | BETULA | Betula pendula Roth & B. pubescens Ehrh. | 3, 8, 10, 13 | 3, 4 |
| 4 | CONIFER | coniferous seedlings | 9 | |
| 5 | DECID | deciduous seedlings | 2 | |
| 6 | PICEA | Picea abies (L.) H. Karst. | 3, 8, 10, 13 | 3, 4 |
| 7 | PICEA | Picea glauca (Moench) Voss | 5, 10 | 5 |
| 8 | PICEA | Picea mariana (Mill.) Britton, Sterns & Poggenb. | 5 | |
| 9 | PINSYL | Pinus sylvestris L. | 3, 8, 10, 13 | 3, 4, 12 |
| 10 | POPTRE | Populus tremula L. | 5, 13, 14 | 4, 14 |
| 11 | PRUPEN | Prunus pensylvanica L. f. | 5, 14 | 14 |
| 12 | QUERCUS | Quercus robur L. & Q. petraea (Matt.) Liebl. | 6 | 6 |
| 13 | SALIX | Salix alaxensis (Andersson) Coville | 7 | |
| 14 | SALIX | Salix brachycarpa Nutt. | 7 | |
| 15 | SALIX | Salix caprea L. | 3, 13 | 1, 3 |
| 16 | SALIX | Salix lasiolepis Benth. | 7 | |
| 17 | SALIX | Salix novae-angliae Andersson | 7 | |
| 18 | SORBUS | Sorbus americana Marshall | 10 | |
| 19 | SORBUS | Sorbus aucuparia L. | 3, 8, 10, 13 | 3 |
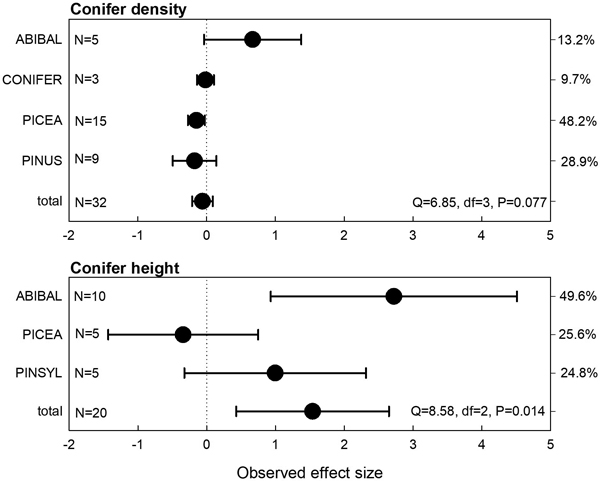
Fig. 1. Observed effect sizes for coniferous seedling or sapling density and height (treatment = moose exclosure) for individual tree species or genera (abbreviations explained in Table 2). Negative values indicate lower seedling densities and positive values higher seedling densities in the moose exclosure plots compared to the non-fenced control plots. Numbers of observations and heterogeneity test results are shown. The right y-axis depicts the weight of observational groups.
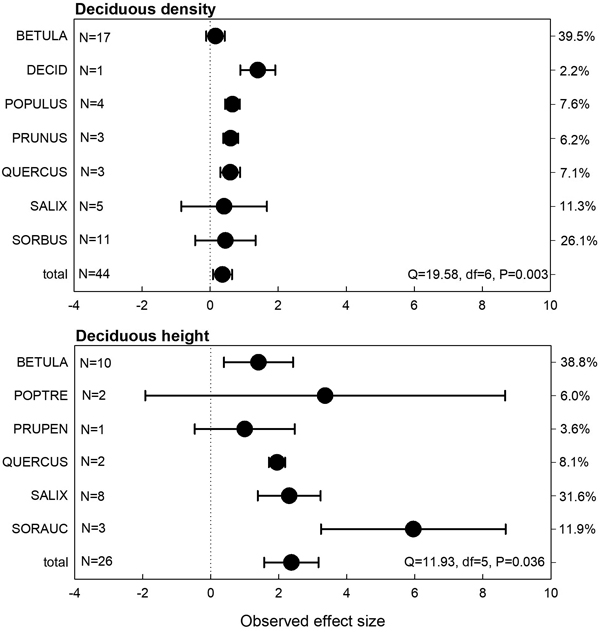
Fig. 2. Observed effect sizes for deciduous seedling or sapling density and height (treatment = moose exclosure) for individual tree species or genera (abbreviations explained in Table 2). Negative values indicate lower seedling densities and positive values higher seedling densities in the moose exclosure plots compared to the non-fenced control plots. Numbers of observations and heterogeneity test results are shown. The right y-axis depicts the weight of observational groups.
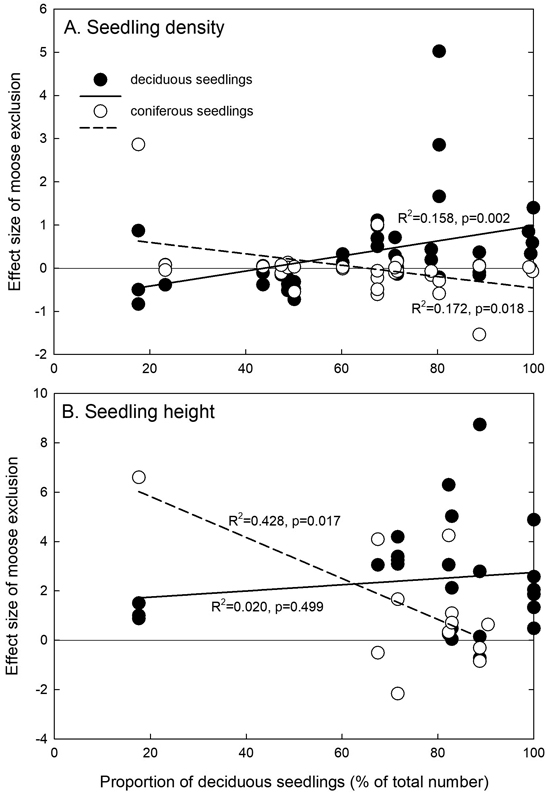
Fig. 3. Relationships between the proportion of deciduous seedlings or saplings (as percentage of the total number) and the effect size of moose exclusion for seedling or sapling (A) density and (B) height. Linear regressions are calculated separately for deciduous and coniferous seedlings. The zero line is indicated, and positive effects sizes indicate positive effects of moose exclusion.
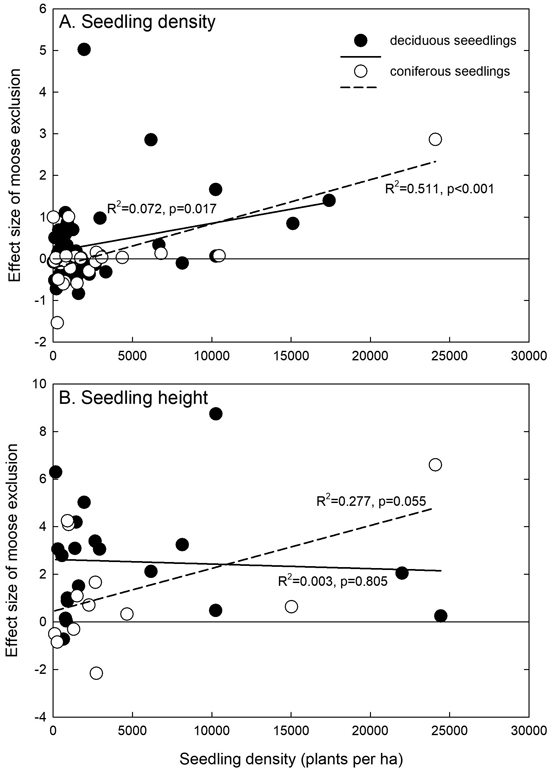
Fig. 4. Relationships between the total stand density (as plants per ha) and the effect size of moose exclusion for seedling or sapling (A) density and (B) height. Linear regressions are calculated separately for deciduous and coniferous seedlings. The zero line is indicated, and positive effect sizes indicate positive effects of moose exclusion.
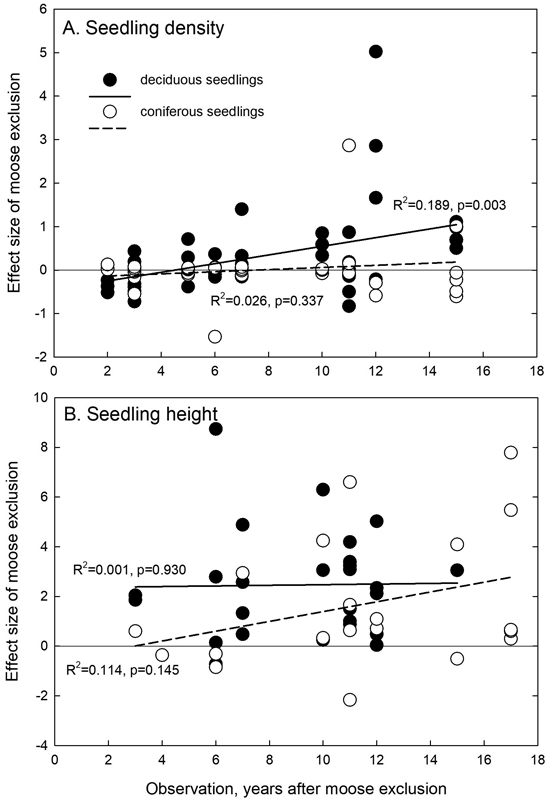
Fig. 5. Relationships between the observation time (years after moose exclusion) and the effect size of moose exclusion for seedling or sapling (A) density and (B) height. Linear regressions are calculated separately for deciduous and coniferous seedlings. The zero line is indicated, and positive effect sizes indicate positive effects of moose exclusion.
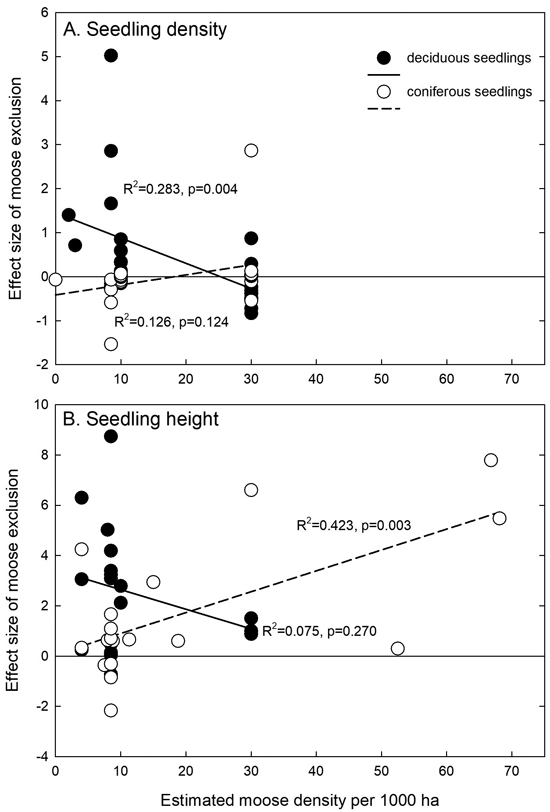
Fig. 6. Relationships between the estimated moose density and the effect size of moose exclusion for seedling or sapling (A) density and (B) height. Linear regressions are calculated separately for deciduous and coniferous seedlings. The zero line is indicated, and positive effect sizes indicate positive effects of moose exclusion.