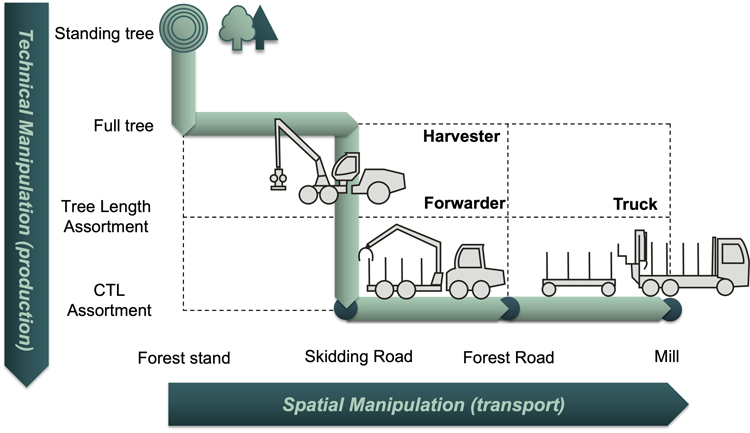
Fig. 1. Functions of fully mechanized timber harvesting (CTL) with harvester, forwarder, and truck from standing tree to assortment (Y-axis, condition of timber, and technical manipulation) and from forest stand to sawmill (X-axis, location of timber, and spatial manipulation). The functiogram shows the technical and spatial manipulation of the timber in the supply process according to the KWF templates (KWF 2019).
| Table 1. Summary of the relevant reviewed literature with the most significant constants for this paper. The table consists of the reviewed literature, the year of the study (not the publication date) and origin, the CO2 emissions, and the constants relevant to this paper. The literature answered heterogeneous questions and therefore produced heterogeneous results. We determined the data on total emissions, those of the harvester use and those of the forwarder use in thinning, final felling, and later thinning, for timber transport, as well as for standard processes such as loading of the timber, relocation of the machine, machine fabrication/supply and maintenance, lubricants, and transport of operator to the job. The values had to be partly converted to get our standard value kg CO2 m–3 or kg CO2 m–3 km–1 (carbon dioxide (kg) per cubic meter of wood or carbon dioxide (kg) per cubic meter of wood and driven kilometer). If no values for transport are available, they are not included in the total, i.e., they only refer to harvester and forwarder use (column 3). | |||
| Reviewed Literature | Year/Origin | CO2 Emission referred to kg CO2 m–3 | Constants of Interest referred to kg CO2 m–3 |
| Kühmaier (2022) | 2018/Austria | Total: 25.63 Harvester: 3.4 Forwarder: 3.7 Truck Transport: 0.02695 km–1 Railway Transport: 0.00939 km–1 | Transport of Machine: 0.013 Lubricants: 0.118 Transport of Operator: 0.079 |
| Karjalainen (1996) | 1996/Finland | No Total Harvester (thinning): 3.896 Harvester (final felling): 1.857 Forwarder (thinning): 1.918 Forwarder (final felling): 1.423 Truck Transport: 0.0303 km–1 Railway Transport: 0.0187 km–1 Waterway Transport: 0.0149 km–1 | |
| Lijewski (2017) | 2017/Poland | No Total Harvester (final felling): 2.112 Forwarder: 1.505 Truck Transport: 0.0616 km–1 | |
| Klvac (2013) | 2011/Czech | Total (final felling): 12.3 Truck Transport: 0.131 km–1 | |
| Puettmann (2013) | 2011/USA | Total (final felling): 14.5 | Lubricants: 0.077 |
| Dias (2007) | 2000/Portugal | No Total Harvester (final felling): 2.315 Forwarder (final felling): 2.431 | Loading Truck: 0.386 |
| Labelle (2019) | 2018/Germany | Total (only thinning): 3.962 Harvester: 1.325 Forwarder: 1.853 | Lubricants (Harvester): 0.0197 Lubricants (Forwarder): 0.0112 for AdBlue, Grease, Oil |
| Haavikko (2022) | 2016/Finland | Total (average): 4.259 Total (final felling): 3.14 Total (thinning): 5.274 Harvester (later thinning): 1.151 Harvester (final felling): 0.893 Forwarder (later thinning): 0.771 Forwarder (final felling): 0.846 | Relocation of Machine: 0.325 |
| Zhang (2016) | 2009/USA | Total (average): 6.994 Total (clear cut): 5.7 Total (selective cut): 8.2875 | Machine fabrication/supply/maintenance: 0.112 |
| Handler (2014) | 2009/USA | Total (average): 15.35 Total (clear cut): 12.3 Total (selective cut): 18.4 Truck Transport: 0.03625 km–1 Railway Transport: 0.00825 km–1 | Machine fabrication/supply/ maintenance: 0.5375 Loading Truck: 0.9625 |
| Kärhä (2022) | 2020/Finland | Total (average): 4.46 Total (final felling): 3.64 Total (thinning): 6.23 Harvester (thinning): 3.96 Harvester (final felling):2.06 Forwarder (thinning): 2.27 Forwarder (final felling):1.58 | Transport of Operator: 0.3705 Relocation of Machine: 0.3249 |
| Table 2. Properties of the main European species of timber for calculating the carbon content in freshly cut wood. Oven dry (kiln) density with 0% moisture content in kg m–3 (d0), Total shrinkage of the volume of the raw wood during drying in % (sV); wood density of fiber-saturated timber in kg m–3 (dfs), carbon content of timber in kg m–3 (C). For the calculation of the specific carbon content (C), a carbon content of 51.9% was assumed. CO2 is obtained by multiplying the specific carbon content of the tree species by the carbon-to-carbon dioxide conversion factor of 3.67. Other deciduous trees include Acer, Pyrus communis, Castanea sativa, Alnus, Fraxinus excelsior, Prunus avium, Tilia, Juglans, Robinia pseudoacacia. Other conifers include Tsuga, and Pinus strobus/radiata. | |||||
| Tree species | Kiln density (Wagenführ and Wagenführ 2021; Lohmann and Blosen 2003) kg m–3 (d0) | Total shrinkage (Wagenführ and Wagenführ 2021; Lohmann and Blosen 2003) % (sV) | Wood density fiber-saturated kg m–3 (dfs) | Carbon content kg m–3 (C) | CO2 content kg m–3 (CO2) |
| Conifer | |||||
| Other conifers | 200 (Diestel and Weimar 2014) | 734 | |||
| Pseudotsuga menziesii | 470 | 11.9 | 414.07 | 275 | 788.692 |
| Picea abies | 430 | 11.8 | 379.26 | 197 | 722.388 |
| Pinus sylvestris | 490 | 11.8 | 432.18 | 224 | 823.186 |
| Abies alba | 410 | 10.85 | 365.515 | 190 | 696.207 |
| Larix decidua | 550 | 13.2 | 477.4 | 248 | 909.318 |
| Deciduous | |||||
| Other deciduous | 275 (Diestel and Weimar 2014) | 1009.25 | |||
| Fagus sylvatica | 680 | 17.9 | 558.28 | 290 | 1063.373 |
| Quercus robur | 650 | 14.1 | 558.35 | 290 | 1063.506 |
| Betula pendula | 610 | 13.95 | 524.905 | 272 | 999.802 |
| Populus nigra | 410 | 12.5 | 358.75 | 186 | 683.322 |
| Table 3. Constants taken from the literature are divided into two operations – harvesting (forwarder and harvester) and timber transport. The parameters to be used in the calculation are either variables such as the data from the forestry machine on diesel consumption, kilometers driven, and timber volume, or constants. The constants refer either to kg CO2 m–3 (carbon dioxide (kg) per cubic meter of wood and driven kilometer) for distances traveled in timber transport or to kg CO2 m–3 (carbon dioxide (kg) per cubic meter of wood) related to volumes of timber provided. For harvesters or forwarders, the constants are transport to stand, lubricants, transport of operators, and fabrication, supply, and maintenance apply. The constants must be considered twice in the calculation, as they apply to both harvesters and forwarders. For timber transport by truck, the constants are lubricants, loading and fabrication, supply, and maintenance. For transport by ship or train, again constants apply. | |||
| Operation and machine | Source of emission | Parameter | Parameter value (CO2) |
| Harvesting/Forwarding (Harvester or Forwarder) | Fuel (Diesel) | Variable | 3.28 kg l–1 (Handler et al. 2014) |
| Volume | Variable | m3 | |
| Transport to stand | Constant | 0.013 kg m–3 (Kühmaier et al. 2022) | |
| Lubricants | Constant | 0.118 kg m–3 (Kühmaier et al. 2022) | |
| Transport of operator | Constant | 0.079 kg m–3 (Kühmaier et al. 2022) | |
| Fabrication, supply, and maintenance | Constant | 0.538 kg m–3 (Handler et al. 2014) | |
| Transportation truck | Kilometers | Variable | km |
| Volume | Variable | m3 | |
| Fuel (Diesel) | Constant | 0.16 kg m–3 km–1 (Klvač et al. 2013) | |
| Lubricants | Constant | 0.00422 kg km–1 (Handler et al. 2014) | |
| Loading | Constant | 0.963 kg m–3 (Handler et al. 2014) | |
| Fabrication, supply, and maintenance | Constant | 0.538 kg m–3 (Handler et al. 2014) | |
| Transportation ship | Waterway (total) | Constant | 0.0153 kg m–3 km–1 (Karjalainen and Asikainen 1996) |
| Transportation train | Railway (total) | Constant | 0.0193 kg m–3 km–1 (Karjalainen and Asikainen 1996) |
| Table 4. Input variables derived from the test cut divided into the accrued assortments of the total volume of timber in m3 over bark (o.b.) and under bark (u.b.), total diesel consumption of harvester and forwarder in liters o.b. and u.b., distance to the sawmill and the proportions of the assortments in the total volume of timber. | ||||
| Assortment | Volume (m3) o.b. / u.b. | Diesel consumption of harvester and forwarder combined (l) o.b. / u.b. | Distance to mill (km) | Share of total quantity (%) |
| 5.0 m sawlogs | 601.4 / 533.1 | 470 / 468.7 | 30 | 65 |
| 2.5 m industrial logs | 168.2 / 149.4 | 131.4 / 131.4 | 108 | 18.2 |
| 3.0 m pulp/paper logs | 19.1 /16.8 | 14.9 / 14.8 | 165 | 2 |
| 3.0 m butt log pieces | 127.8 / 115.2 | 100 / 101.3 | 172 | 14 |
| 2.4 m logs for pallets | 7.4 /6.7 | 5.8 / 5.9 | 117 | 0.8 |
| Table 5. Results of the calculations to determine the CO2 emissions for the individual assortments from the timber transport, timber harvesting with the harvester, and transport with the forwarder, each in kg CO2 m–3 (carbon dioxide (kg) per cubic meter of wood) over bark (o.b.) and under bark (u.b.). In the case of timber transport, the distances covered individually are already included. Columns 5 and 6 summarize the CO2 emissions. In column 5 per m3 and column 6 over for the total amount per assortment. Column 7 shows the total amount of CO2 stored in the provided timber for each assortment in tons. | |||||||||||
| Assortment/ Emissions | Truck CO2 | Harvester CO2 | Forwarder CO2 | Truck/Harvester/Forwarder CO2 | Total CO2 | Total C-Storage CO2 | |||||
| kg m–3 u.b./o.b. | kg m–3 o.b. | kg m–3 u.b. | kg m–3 o.b. | kg m–3 u.b. | kg m–3 o.b. | kg m–3 u.b. | t o.b. | t u.b. | t o.b. | t u.b. | |
| 5.0 m sawlogs | 6.4 | 2.058 | 2.221 | 2 | 2.161 | 10.5 | 10.8 | 5.906 | 5.406 | 434.4 | 385.1 |
| 2.5 m industrial logs | 19.24 | 23.3 | 23.6 | 3.751 | 3.380 | 121.5 | 107.9 | ||||
| 3.0 m pulp/paper logs | 28.6 | 32.6 | 33.0 | 0.601 | 0.534 | 13.8 | 12.1 | ||||
| 3.0 m butt log pieces | 29.75 | 33.8 | 34.1 | 4.159 | 3.787 | 92.3 | 83.2 | ||||
| 2.4 m logs for pallets | 20.71 | 24.8 | 25.1 | 0.177 | 0.161 | 5.4 | 4.8 | ||||
| Mean | 20.9 | 2.058 | 2.221 | 2 | 2.161 | 25 | 27.32 | - | - | - | - |
| Table 6. Net carbon storage of the supplied timber by assortment. Thus, it is a value derived from the CO2 stored in the timber minus the CO2 emitted during timber supply. Net carbon storage is given as an absolute value in kg CO2 m–3 (carbon dioxide (kg) per cubic meter of wood) over bark (o.b.) and under bark (u.b.). The rate by which carbon storage must be reduced is given here as %. | ||||
| Assortment | C-Storage | C-Storage reduction rate | ||
| kg CO2 m–3 reduced by CO2 o.b. | kg CO2 m–3 reduced by CO2 u.b. | % o.b. | % u.b. | |
| 5 m Sections | 711.9 | 711.0 | 1.47 | 1.51 |
| 2.5 m Industrial | 699.1 | 689.8 | 3.33 | 3.38 |
| 3 m Paper | 689.7 | 689.4 | 4.73 | 4.78 |
| 3 m Butt log pieces | 688.6 | 688.3 | 4.90 | 5.00 |
| 2.4 m Palette | 697.6 | 697.3 | 3.50 | 3.60 |
| On Average | 2.19 | 2.24 | ||
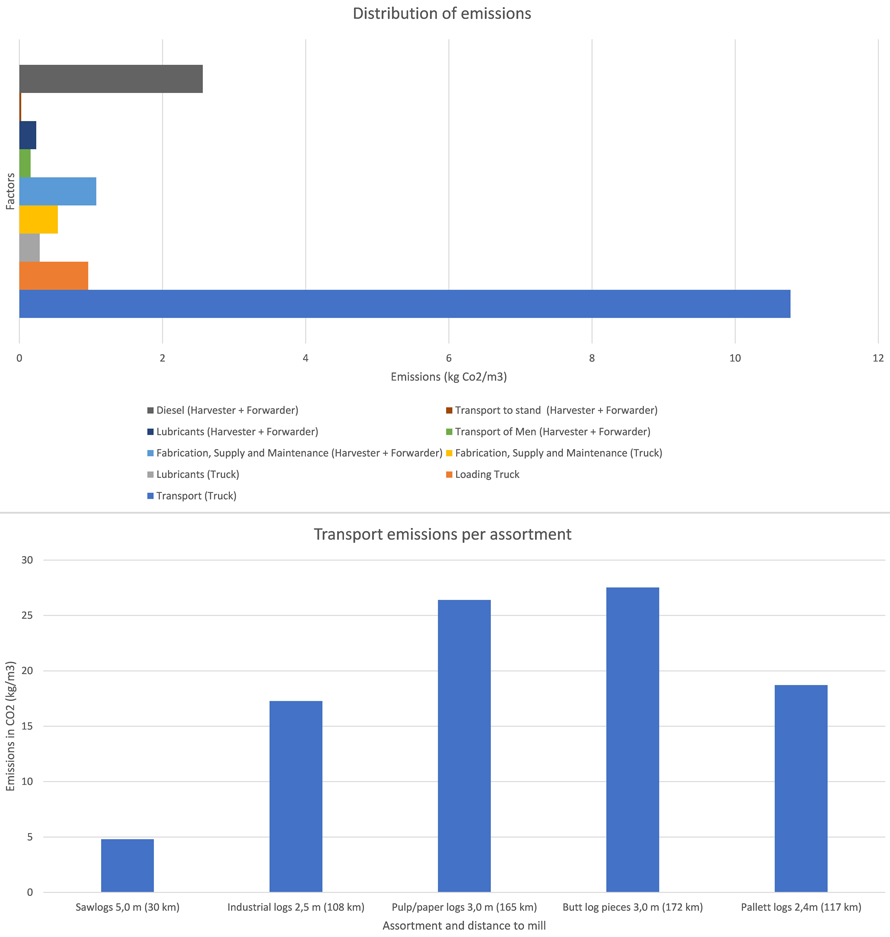
Fig. 2. Influences of the individual factors on the CO2 emissions of a cubic meter of timber in the entire fully mechanized timber supply chain. In the upper graph, all influencing factors are displayed together. In the lower graph, a special focus is placed on the CO2 emissions per assortment depending on the transport distance, to reflect the influence of the distance to mill. View larger in new window/tab.