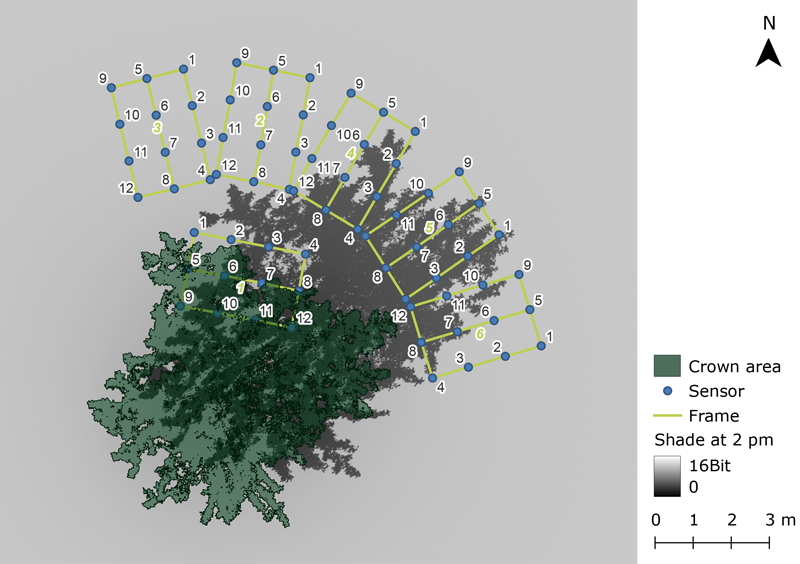
Fig. 1. Overview of the experimental setup. The green rectangles represent the wooden frames with the mounted sensors for photosynthetically active radiation (blue circles). The green numbers indicate the logger IDs, and the black numbers indicate the sensor IDs. Logger 3 was relocated and reappeared as logger 6. The dark grey area indicates the simulated shade at 2 pm. The green area shows the crown projection area of the tree.
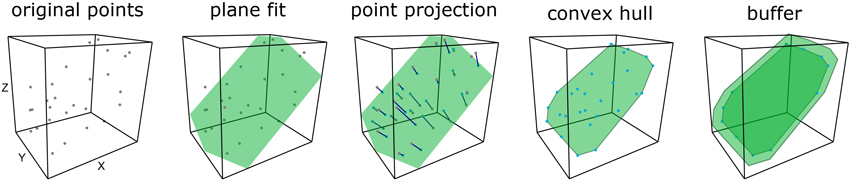
Fig. 2. Illustration of the leaf polygon geometry reconstruction workflow from light detection and ranging (LiDAR) point clouds for a single voxel. A plane is fit to the points and points are projected to the plane. The final polygon is constructed as the convex hull of the points plus a small buffer to avoid edge effects.
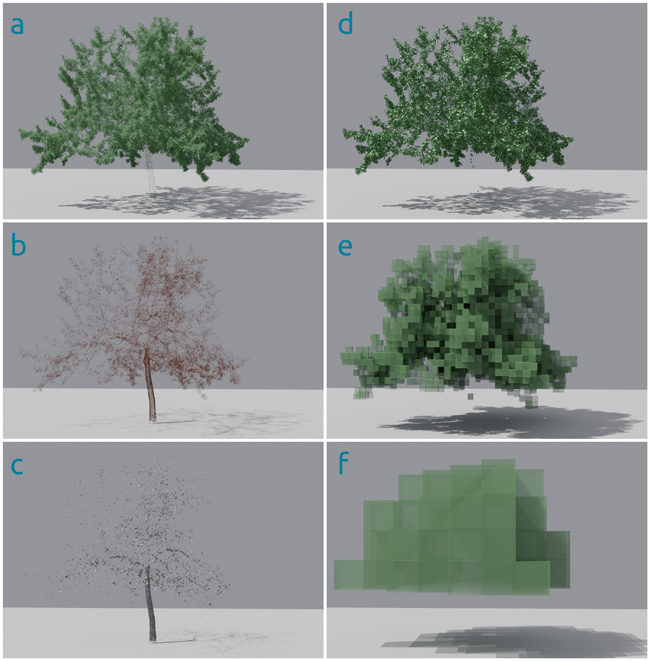
Fig. 3. Terrestrial light detection and ranging (LiDAR) Point cloud of a single Malus domestica tree classified as leaf (a) and wood (b) points and reconstructed polygons with simulated shade for wood (c) and leave points (d). Figures e and f illustrate the voxels for the turbid media approach in 0.2 (e) and 1 m (f) voxel resolution. Figures were generated in Blender ray tracing software for visualization purposes.
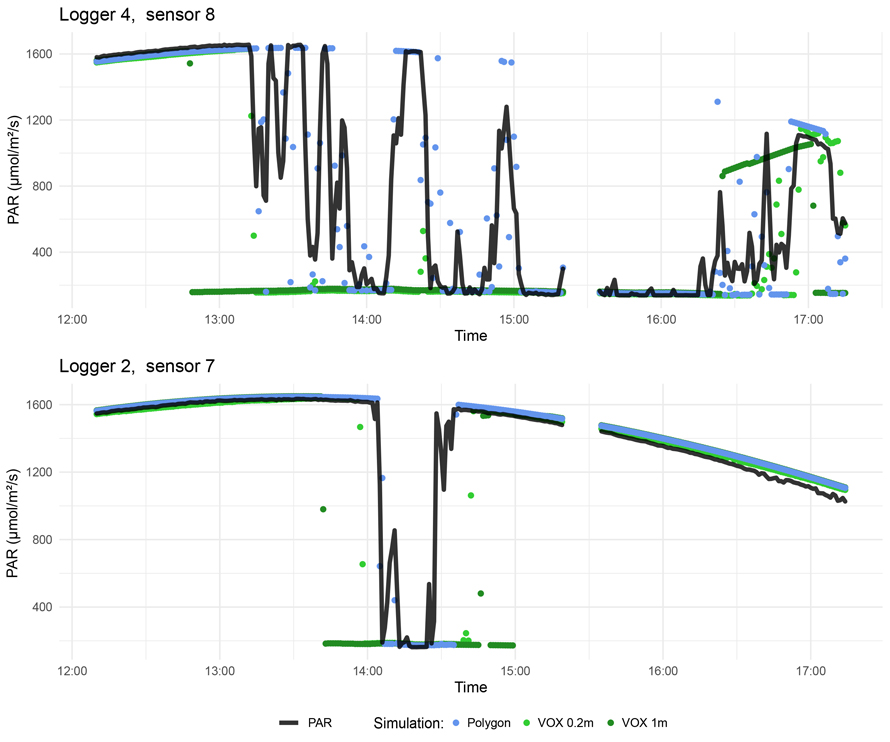
Fig. 4. Results from the radiative transfer model (LESS) for two photosynthetically active radiation (PAR) sensors next to the Malus domestica tree. Measured PAR values are depicted in black lines and simulated PAR values from the Polygon based simulation as blue dots, the 0.2 m voxel based simulation as light green dots and 1 m voxel based reconstruction as dark green dots.
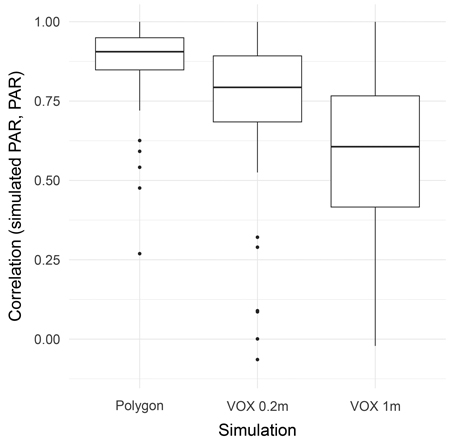
Fig. 5. Boxplots of the correlations per sensor between measured and simulated photosynthetically active radiation under and next to a tree for the three single radiative transfer simulations based on light detection and ranging (LiDAR) data reconstructed as discrete polygons, 0.2 m turbid voxels and 1 m turbid voxels.