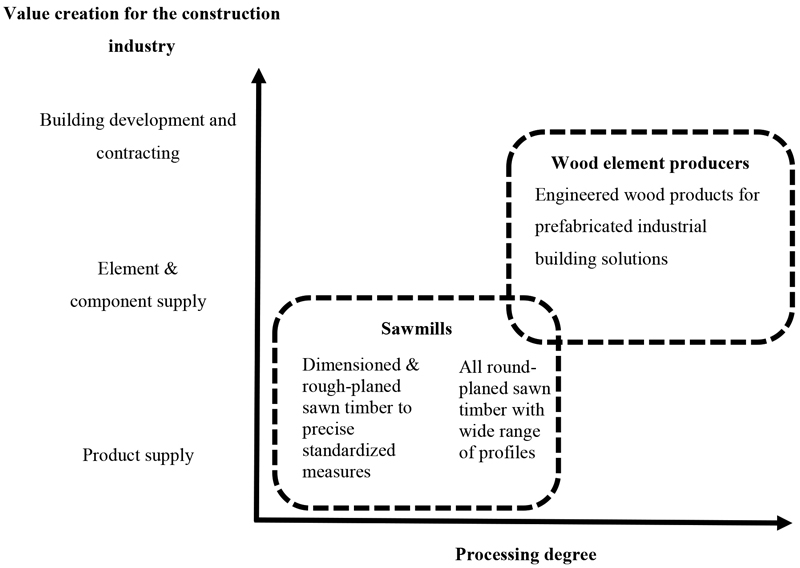
Fig. 1. Processing degree in mechanical wood industries combined with value creation for the construction industry. Through supplier-customer relationships, sawmills and wood element producers connect with each other through their products and services for building processes (dashed lines) (modified from Brege et al. 2014).
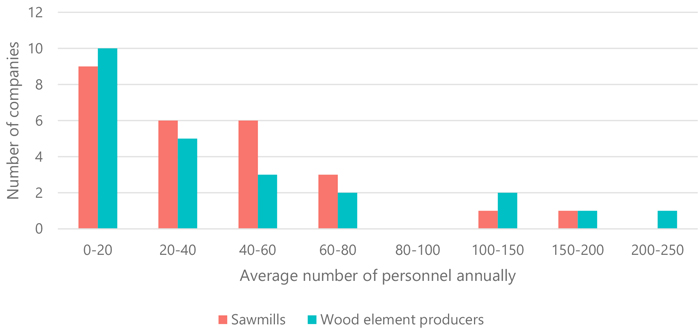
Fig. 2. Distribution of studied sawmills and wood element producers by number of average personnel annually.
| Table 1. Financial information to assess monetary drivers and outcomes of firms-specific competitiveness, their equations, and sources of information. | |||
| Monetary information | Key ratio | Equation | Source of financial information |
| Ex-ante drivers of competitiveness | |||
| Material costs | Material use / Turnover | Material use / Turnover | Income statement |
| Employment costs | Salaries / Turnover | Salaries / Turnover | Income statement |
| Net value of investments | Investments / Turnover | (Change in intangible and tangible assets between consecutive years – depreciation) / Turnover | Balance sheet (assets), income statement (depreciation) |
| Value creation | Value-added / Turnover | = (Sales – Bought services – Material costs) / Turnover. | Income statement |
| Ex-post outcomes of competitiveness | |||
| Liquidity | Current Ratio | = (Inventories + Financial assets) / Short-term liabilities | Balance sheet |
| Solvency | Equity Ratio | = Adjusted total equity (i.e., shareholders’ equity) / (Adjusted balance sheet total – Advances received) | Balance sheet |
| Profitability (absolute) | Net Profit Ratio (%) | = (Net result / Turnover) × 100% | Income statement |
| Profitability (relative) | ROCE (%) | = (Net result + Financing costs + taxes 12 months) / Average. capital employed × 100% | Income statement and balance sheet |
| All the ex-ante variables are measured as euros and ex-post outcomes are ratios derived from calculations. The income statement captures the operational flow for the accounting period, while the balance sheet reflects the cumulative financial position, including retained earnings. | |||
| Table 2. Variance inflation factor (VIF) values for full models for sawmill and element producer. | |||||||||
| Sawmills | |||||||||
| Ln Current Ratio | Equity Ratio | Net Profit Ratio (%) | ROCE (%) | ||||||
| Salaries | 1.05 | 1.04 | 1.2 | 1.3 | |||||
| Materials | 1.6 | 1.54 | 1.81 | 1.76 | |||||
| Investments | 1.01 | 1.01 | 1.04 | 1.01 | |||||
| Value-added | 1.5 | 1.49 | 1.68 | 1.62 | |||||
| Element producers | |||||||||
| Ln Current Ratio | Equity Ratio | Net Profit Ratio (%) | ROCE (%) | ||||||
| Salaries | 3.13 | 3.12 | 2.68 | 1.09 | |||||
| Materials | 2.09 | 2.09 | 2.02 | 1.44 | |||||
| Investments | 3.24 | 3.27 | 3.05 | 1.07 | |||||
| Value-added | 1.63 | 1.63 | 1.76 | 1.44 | |||||
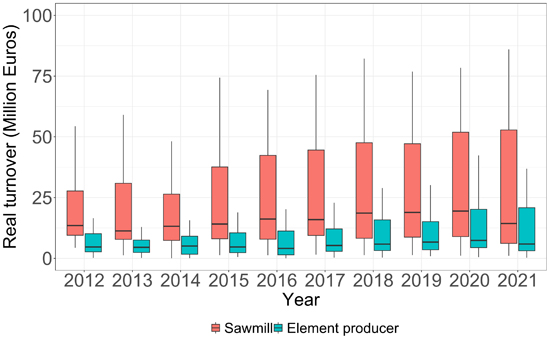
Fig. 3. Annual real turnover (million euros) of sawmills and wood element producers, adjusted to 2021 prices using producer price indices, products by activity, presented as industry-level distributions. The dataset includes 234 observations for wood element producers and 266 for sawmills in terms of turnover.
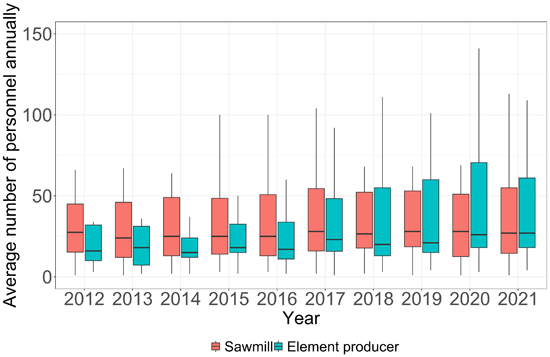
Fig. 4. Average number of personnel annually as full-time employment equivalents of sawmills and wood element producers, presented as industry-level distributions. The dataset includes 207 observations for wood element producers and 249 for sawmills in terms of personnel.
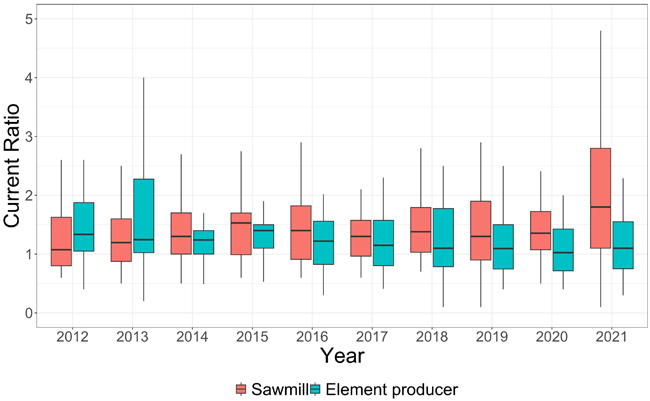
Fig. 5. Development of Current Ratio over ten accounting periods, grouped by industry. The figure represents the distribution of values for sawmills and wood element producers in each accounting period.
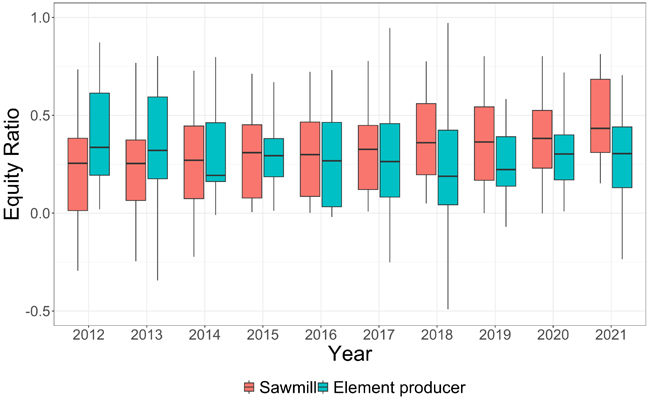
Fig. 6. Development of Equity Ratio over ten accounting periods, grouped by industry. The figure represents the distribution of values for sawmills and wood element producers in each accounting period.
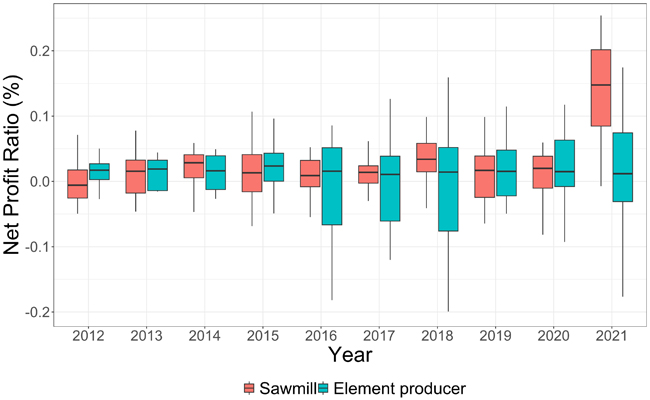
Fig. 7. Development of Net Profit Ratio (%) over ten accounting periods, grouped by industry. The figure represents the distribution of values for sawmills and wood element producers in each accounting period.
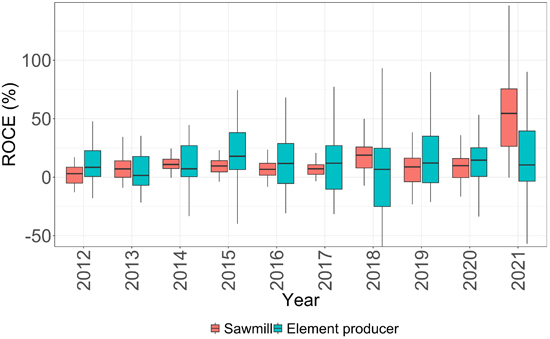
Fig. 8. Development of ROCE (%) over ten accounting periods, grouped by industry. The figure represents represent the distribution of values for sawmills and wood element producers in each accounting period.
| Table 3. Explanatory variable averages by year and industry. Standard deviations in parenthesis. The higher value of the two industries is in bold. Values in million euros. | ||||||||
| Materials | Salaries | Value-added | Investments | |||||
| Sawmills | Element producers | Sawmills | Element producers | Sawmills | Element producers | Sawmills | Element producers | |
| 2012 | 9 (6.8) | 2.9 (2.8) | 1.4 (1) | 1.1 (1.1) | 4.1 (3.2) | 1.2 (1.7) | 0.3 (0.4) | 0.4 (0.5) |
| 2013 | 8.6 (7.1) | 2.5 (2.5) | 1.3 (1) | 1 (1) | 4.1 (3.7) | 1.2 (1.3) | 0.4 (0.6) | 0.2 (0.2) |
| 2014 | 9.3 (7.7) | 2.3 (2.1) | 1.3 (0.9) | 0.8 (0.9) | 3.3 (3.4) | 1 (1) | 0.9 (1.3) | 0.2 (0.3) |
| 2015 | 10.2 (9) | 2.7 (2.3) | 1.5 (1.2) | 1.1 (1) | 4.3 (3.7) | 1.1 (1.7) | 3 (7.4) | 0.3 (0.3) |
| 2016 | 10.6 (9.1) | 2.7 (3.2) | 1.5 (1.1) | 1.1 (1.2) | 4.3 (3.9) | 1.3 (2.7) | 0.8 (1) | 0.7 (1.4) |
| 2017 | 11.2 (10) | 4 (5.7) | 1.5 (1.2) | 1.6 (2.3) | 4.8 (4.3) | 1.9 (2.9) | 0.7 (0.9) | 1.1 (2.9) |
| 2018 | 12.8 (11.6) | 5.2 (8) | 1.7 (1.2) | 2 (3) | 5.3 (4.5) | 2.5 (3.9) | 0.8 (1.2) | 0.9 (2.7) |
| 2019 | 12.8 (11.2) | 4.6 (5.9) | 1.7 (1.3) | 2 (2.5) | 5 (4.1) | 3.2 (5.6) | 0.6 (0.7) | 0.3 (0.4) |
| 2020 | 12.5 (11.2) | 4.2 (4.8) | 1.7 (1.3) | 1.9 (2.1) | 5 (4.2) | 3.1 (4.1) | 0.6 (0.7) | 0.7 (1.2) |
| 2021 | 15.8 (14.5) | 6.9 (7.7) | 1.9 (1.5) | 2.4 (2.7) | 10.3 (9.7) | 3.3 (5.3) | 1.1 (1.3) | 0.4 (0.5) |
| Average | 11.3 (9.8) | 3.8 (4.5) | 1.6 (1.2) | 1.5 (1.8) | 5.1 (4.5) | 2 (3) | 1 (1.5) | 0.5 (1) |
| Table 4. Parameter estimates from linear mixed-effects models for sawmills, based on four financial performance indicators: salaries, materials, investments, and value-added). Intercept terms are included for reference. | ||||
| Ln Current Ratio | Equity Ratio | Net Profit Ratio (%) | ROCE (%) | |
| Liquidity | Solvency | Profitability (absolute) | Profitability (relative) | |
| (Intercept) | 0.66 (0.32)** | 0.7 (0.27)*** | 0.32 (0.08)*** | 0.92 (0.24)*** |
| Salaries | –3.22 (1.15)*** | –0.84 (0.81) | –0.68 (0.16)*** | –1.46 (0.46)*** |
| Materials | 0.27 (0.43) | –0.82 (0.37)** | –0.39 (0.1)*** | –0.62 (0.32) |
| Investments | –0.33 (0.13)*** | –0.24 (0.08)*** | –0.02 (0.02) | –2.05 (0.32)*** |
| Value-added | –0.08 (0.26) | 0.27 (0.22) | 0.15 (0.08)** | 0.54 (0.24)** |
| N | 241 | 246 | 247 | 243 |
| R2 | 0.59 | 0.79 | 0.46 | 0.42 |
| Significance levels: **5%, ***1% level. | ||||
| Table 5. Parameter estimates from linear mixed-effects models for wood construction element producers, based on four financial performance indicators: salaries, materials, investments, and value-added. Intercept terms are included for reference. | ||||
| Ln Current Ratio | Equity Ratio | Net Profit Ratio (%) | ROCE (%) | |
| Liquidity | Solvency | Profitability (absolute) | Profitability (relative) | |
| (Intercept) | 0.35 (0.18) | 0.31 (0.11)*** | 0.35 (0.09)*** | 0.74 (0.22)*** |
| Salaries | 0.01 (0.22) | –0.08 (0.14) | –0.89 (0.1)*** | –0.75 (0.32)** |
| Materials | –0.7 (0.26)*** | –0.23 (0.16) | –0.49 (0.12)*** | –1.01 (0.34)*** |
| Investments | 0.01 (0.02) | 0.02 (0.01)** | –0.11 (0.01)*** | –0.1 (0.33) |
| Value-added | –0.03 (0.12) | 0.24 (0.08)*** | 0.19 (0.07)** | 0.12 (0.16) |
| N | 210 | 210 | 209 | 196 |
| R2 | 0.47 | 0.33 | 0.9 | 0.42 |
| Significance levels: **5%, ***1% level. | ||||
| Table 6. Summary of hypotheses’ outcomes and their rationale. | ||
| Hypothesis | Outcome | Rationale |
| H1: Profitability ratios show higher variation for wood element producers operating in an emerging industry than for sawmills. | Not rejected | According to Figures 7 & 8, there is more variation in profitability measures of element producers than sawmills |
| H2: Material and salary costs have a negative impact on the financial performance of both sawmills and wood element producers. | Not rejected | According to Tables 4 & 5, only negative impacts were found for Salaries and Materials on both industries’ competitiveness measures |
| H3: Investment costs have a negative impact on financial performance of both sawmills and wood element producers. | Inconclusive | According to Tables 4 & 5, Investments show a varying effect on industries’ Equity Ratio (negative for sawmills, positive for element producers), as well as a negative effect on sawmills’ Current Ratio and ROCE (%), and a negative effect on element producers’ Net Profit Ratio (%) |
| H4: Value-added has a positive impact on financial performance of both sawmills and wood element producers. | Not rejected | According to Tables 4 & 5, Value-added has a positive effect on sawmills’ Net Profit Ratio (%) and ROCE (%), and element producers’ Equity Ratio and Net Profit Ratio (%) |