| Table 1. Description of the nitrogen (N) fertilization studies from Finland, included in the dataset. FN is the applied N dose, MAAT the mean annual air temperature, Pa the annual precipitation, and Tsum the effective temperature sum. The site type was classified according to the Cajander (1949) site classification system. The initial stand volume (Vini) range indicates the stand structure before fertilization. SF is the time since fertilization in years and n is the number of observations included into the dataset. | |||||||||||
| Article | Latitude | FN (kg ha–1) | MAAT (°C) | Pa (mm) | Tsum (d.d.) | Tree species | Vini (m3 ha–1) | Site type | SF (yrs.) | n | Reference |
| 1 | 60°26´–67°54´N | 120 | –1.2–4.4 | 470–590 | 900–1180 | Pinus sylvestris, Picea abies | 113–200 | MT, VT, CT | 10 | 12 | Laakkonen et al. (1983) |
| 2 | 61°45´–67°17´N | 120 | –1.0–3.2 | 430–640 | 790–1280 | Pinus sylvestris, Picea abies | 122–175 | MT, VT | 5 | 68 | Lipas & Levula (1980) |
| 3 | 64°48´N | 156–208 | 1.8 | 596 | 990 | Pinus sylvestris | 81–123 | MT, VT | 11 | 10 | Moilanen & Meriluoto (1984) |
| 4 | 62°40´–64°07´N | 100 | 1.7 | 630 | 1090 | Pinus sylvestris, Picea abies | 50–230 | MT, VT, CT | 4 | 12 | Salonen (1973) |
| 5 | 66°30´–68°54´N | 54–200 | –0.9–0.3 | 400–540 | 740–880 | Pinus sylvestris | 62–70 | VT | 4–10 | 6 | Lipas et al. (1983) |
| 6 | 61°24´–67°39´N | 120 | –1.1–3.2 | 520–610 | 800–1190 | Pinus sylvestris, Picea abies | 103–180 | MT, VT | 10 | 32 | Lipas (1988) |
| 7 | 61°59´N | 180 | 3.6 | 714 | 1130 | Pinus sylvestris | 112 | VT | 5 | 4 | Levula (1991) |
| 8 | 63°19´–64°53´N | 60–180 | 0.3–5.5 | 590–600 | 910–1020 | Pinus sylvestris, Picea abies | 106 | MT, VT | 5 | 18 | Gustavsen & Lipas (1975) |
| 9 | 66°30´–67°24´N | 170 | –1.3–0.2 | 500–540 | 797–840 | Pinus sylvestris | 65–74 | MT, VT | 7 | 3 | Hirvelä & Hynynen (1990) |
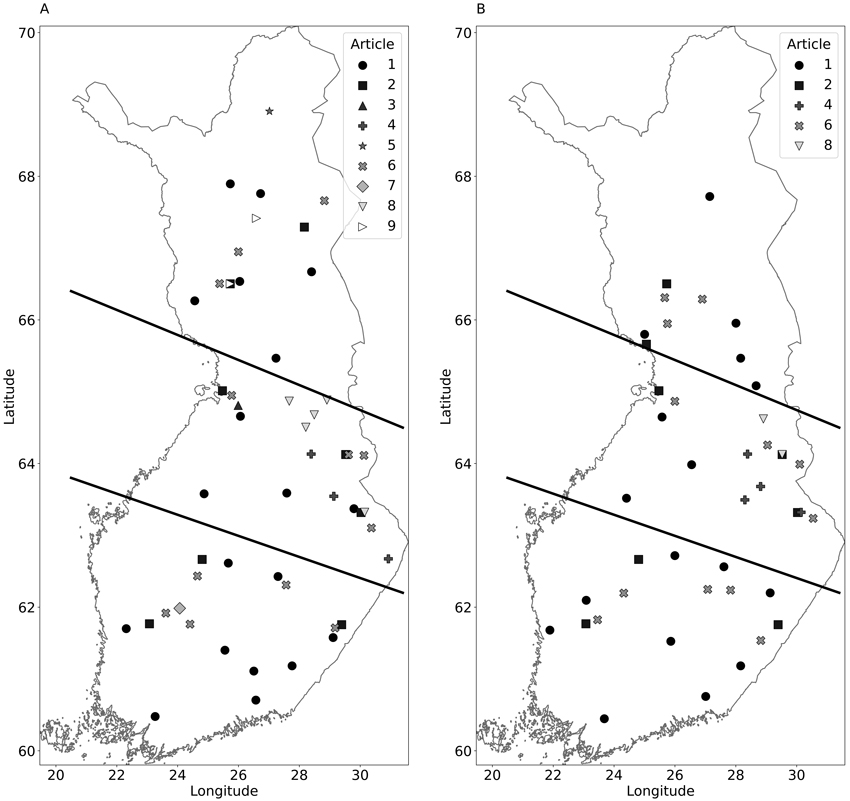
Fig. 1. Location of Scots pine sites (A) and Norway spruce sites (B) presented in the 9 reviewed articles (see Table 1 for references and article ids). The dataset contained 108 Scots pine observations and 57 Norway spruce observations from 97 different locations in Finland, covering a wide range of N dose, initial stand volumes, site types, and climatic conditions. Lines represent the grouping of observations based on location. The lines follow roughly the temperature sum, the northernmost part is temperature sum below 1000 d.d., middle is 1000–1200 d.d., and the southernmost is over 1200 d.d.
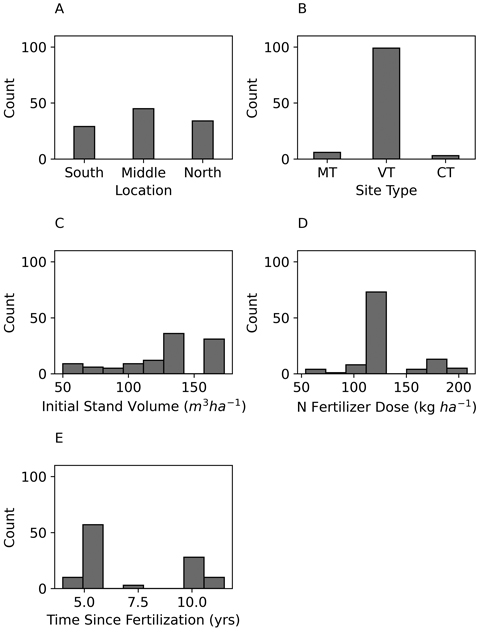
Fig. 2. Frequencies of Scots pine study site locations in Finland (A), site types according to Cajander (1949) (B), initial stand volumes (C), applied N fertilizer doses (D), and time since fertilization (E).
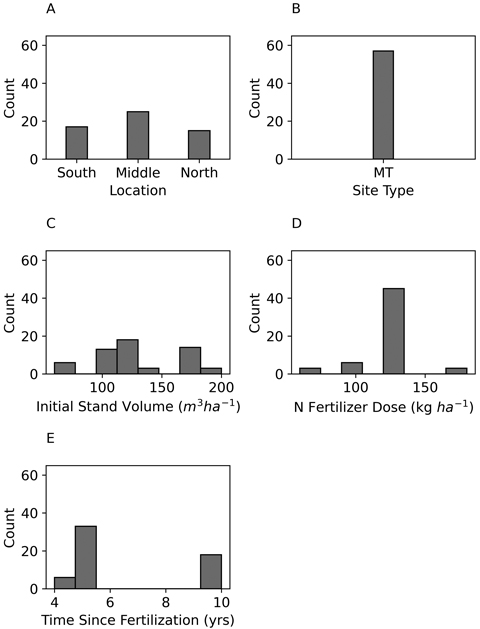
Fig. 3. Frequencies of Norway spruce study site locations in Finland (A), site types according to Cajander (1949) (B), initial stand volumes (C), applied N fertilizer doses (D), and time since fertilization (E).
| Table 2. Variables used in modeling the volume growth response of Scots pine and Norway spruce and the range of values in the dataset compiled from fertilization studies made in Finland. | ||||
| Variables | Coefficients | Description | Range of values in Scots pine data | Range of values in Norway spruce data |
| y | Annual mean volume growth response obtained by N fertilization (m3 ha–1 yr–1) | 0.18–2.7 | 0.36–2.3 | |
| FN | 1 | Applied dose of nitrogen (kg ha–1) | 54–208 | 59.8–180 |
| Pa | 2 | Mean annual precipitation (mm) | 396–714 | 472–630 |
| Gfertility | 3 | Site fertility group: Boolean, 1 when Site type ∈ [MT], else 0 | 0, 1 | 0, 1 |
| Tsum | 4 | Effective temperature sum (d.d.) | 743–1282 | 884–1283 |
| Gsouth | 5 | Area group: Boolean, 1 when in Southern Finland, else 0 | 0, 1 | 0, 1 |
| Gmiddle | 6 | Area group: Boolean, 1 when in Middle Finland, else 0 | 0, 1 | 0, 1 |
| Gnorth | 7 | Area group: Boolean, 1 when in Northern Finland, else 0 | 0, 1 | 0, 1 |
| Glat | 8 | Latitude of the stand in decimal degree | 61.76–68.91 | 61.76–66.50 |
| Vini | 9 | Initial stand volume (m3 ha–1) | 47–173 | 60–200 |
| SF | 10 | Time since fertilization | 4–15 | 4–15 |
| Aid | 11 | Identification number of the article where the data is from | 1–9 | 1, 2, 4, 8 |
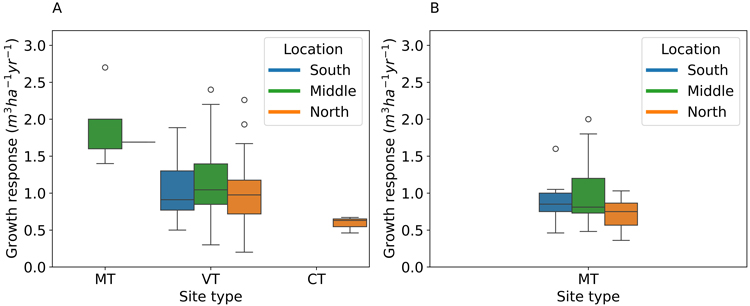
Fig. 4. The volume growth response of Scots pine (A) to N fertilization in different site types and geographical locations, and the volume growth response of Norway spruce (B) in different locations (data only available from medium-fertile (MT) sites). The site type classification is according to Cajander (1949), and all the sites are located in Finland.
| Table 3. Comparison of alternative linear mixed models (Eq. 1) for volume growth responses to nitrogen fertilization in Scots pine and Norway spruce. The best model based on AIC-values (bold) and models with single explanatory variables (variables and their units are presented in Table 2). DF is degrees of freedom, AIC is Akaike’s Information Criteria, R2 is coefficient of determination of the fixed effects, and RMSE is residual mean square error. The models are ranked according to the AIC-value. | ||||||
| Tree species | Independent predictors included in Eq. 1 | DF | AIC | R2 | RMSE | p-value |
| Scots pine | FN + Pa + Gfertility + SF | 107 | 73.3 | 0.547 | 0.318 | <0.001 |
| FN | 107 | 105.7 | 0.314 | 0.360 | <0.001 | |
| Gfertility | 107 | 124.2 | 0.090 | 0.376 | 0.003 | |
| Pa | 107 | 127.3 | 0.050 | 0.378 | 0.016 | |
| SF | 107 | 127.6 | 0.178 | 0.368 | 0.016 | |
| Norway spruce | FN + Pa + SF | 56 | 2.7 | 0.510 | 0.204 | <0.001 |
| FN | 56 | 9.7 | 0.240 | 0.210 | <0.001 | |
| Pa | 56 | 33.1 | 0.101 | 0.272 | 0.041 | |
| SF | 56 | 34.5 | 0.157 | 0.278 | 0.169 | |
| Table 4. Parameter values of the fixed and random effects of the best linear mixed models for Scots pine and Norway spruce volume growth responses. The volume growth response is in units of m3 ha–1 yr–1 and explanatory variables, and their units are presented in Table 2. | ||||||
| Scots pine | Norway spruce | |||||
| Fixed effects | β | SE | p-value | β | SE | p-value |
| Intercept | –0.271 | 0.319 | 0.399 | –1.254 | 0.598 | 0.041 |
| FN (kg N ha–1) | 0.009 | 0.001 | <0.001 | 0.009 | 0.001 | <0.001 |
| Pa (mm) | 0.001 | 0.001 | 0.022 | 0.003 | 0.001 | 0.006 |
| Gfertility | 0.619 | 0.155 | <0.001 | |||
| SF (yrs.) | –0.071 | 0.013 | <0.001 | –0.059 | 0.023 | 0.086 |
| Random effects | Variance | SD | Variance | SD | ||
| Aid | <0.001 | <0.001 | 0.012 | 0.107 | ||
| Residual | 0.101 | 0.318 | 0.044 | 0.211 | ||

Fig. 5. Mean annual measured (dots) and modeled (lines, the best models according to Table 4) volume growth responses as a function of applied N fertilizer dose for different annual precipitation (Pa), site fertility level (Gfertility = 1 includes MT, and Gfertility = 0 includes VT and CT, Cajander (1949)). Pa values represent conditions in Northern (red and orange lines) and Southern (blue and green lines) Finland while time since fertilization (SF) is set to 10 years for both tree species. Panel A shows Scots pine and B the Norway spruce volume growth responses.