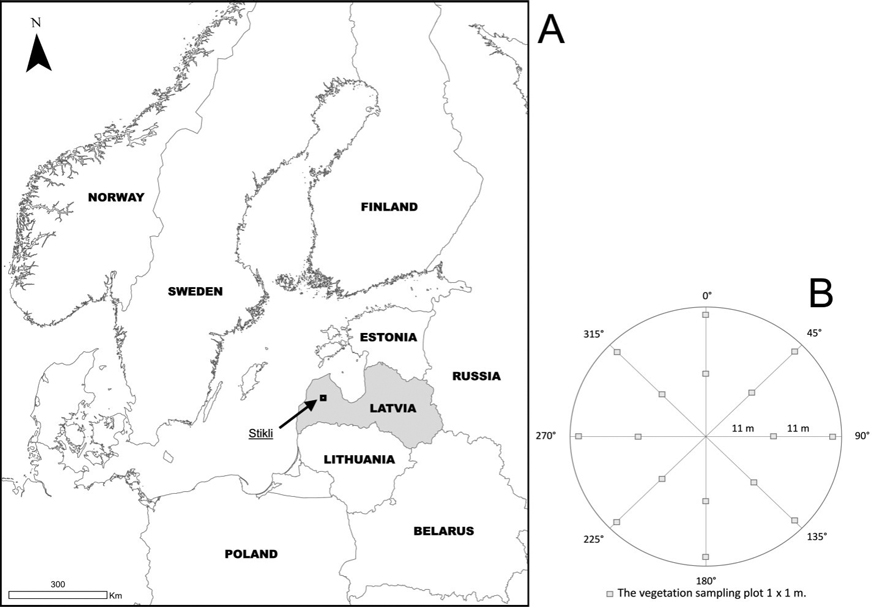
Fig. 1. The location of study area (A) and sampling design of the sample plots per each study site (B).
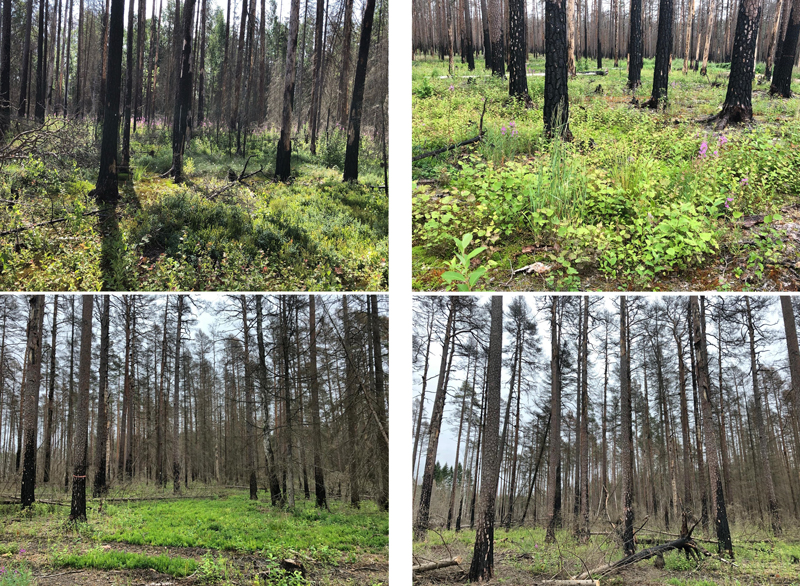
Fig. 2. Vegetation recovery after wildfire in Northern Latvia study sites dominated by Scots pine (Pinus sylvestris) (photo: Līga Liepa).
| Table 1. Main characteristics of studied burned stands (n = 7). | |||
| No. | Coordinates | Forest site type* | Stand age (2019) |
| 1 | 57.329 N; 22.272 E | Oxalidosa | 67 |
| 2 | 57.329 N; 22.271 E | Vaccinioso-sphagnosa | 67 |
| 3 | 57.327 N; 22.270 E | Vacciniosa | 157 |
| 4 | 57.327 N; 22.268 E | Vacciniosa | 157 |
| 5 | 57.326 N; 22.268 E | Vacciniosa | 64 |
| 6 | 57.326 N; 22.270 E | Vaccinioso-sphagnosa | 157 |
| 7 | 57.325 N; 22.267 E | Vacciniosa | 167 |
| * Forest types according to Bušs (1997). | |||
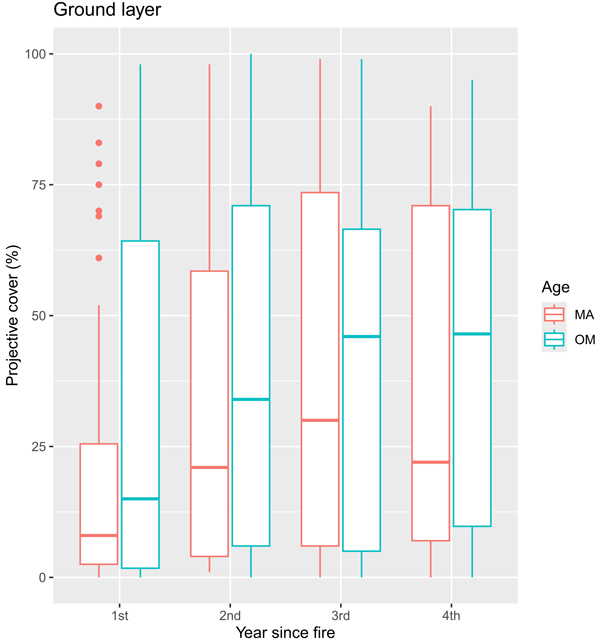
Fig. 3. Boxplots showing the median and the spread of the data with outliers of vegetation projective cover (%) for ground layer during four years after fire in sample plots (n = 112). MA – middle-aged stands, OM – over-mature stands.
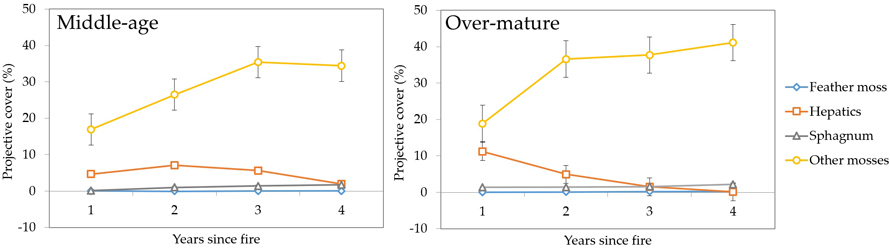
Fig. 4. Changes in ground layer vegetation projective cover (%) during four years after fire in sample plots (n = 112). Standard errors are shown.
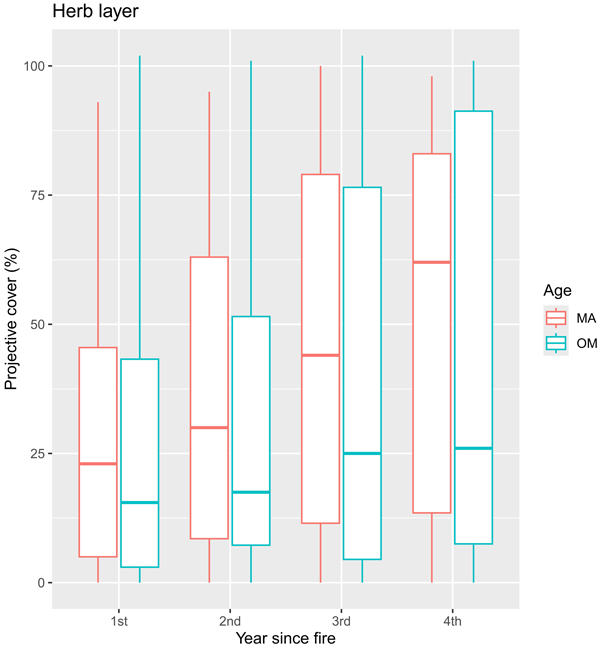
Fig. 5. Boxplots showing the median and the spread of the data with outliers of vegetation projective cover (%) for herb layer during four years after fire in sample plots (n = 112). MA – middle-aged stands, OM – over-mature stands.
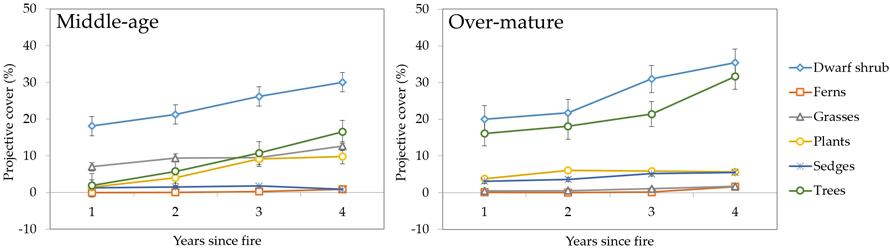
Fig. 6. Changes in herb layer vegetation projective cover (%) during four years after fire in sample plots (n = 112). Standard errors are shown.
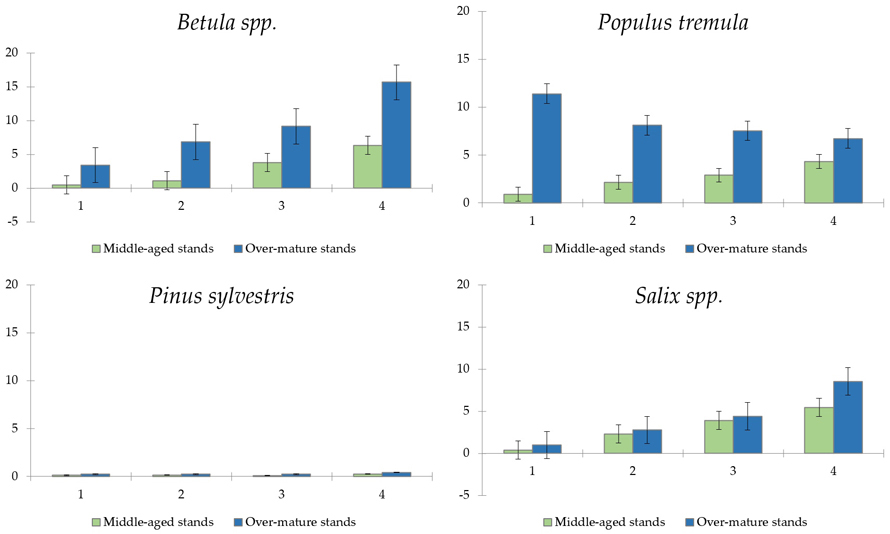
Fig. 7. Projective cover (%) by regenerating tree species in the middle-aged and over-mature stands (n = 112). Standard errors are shown.
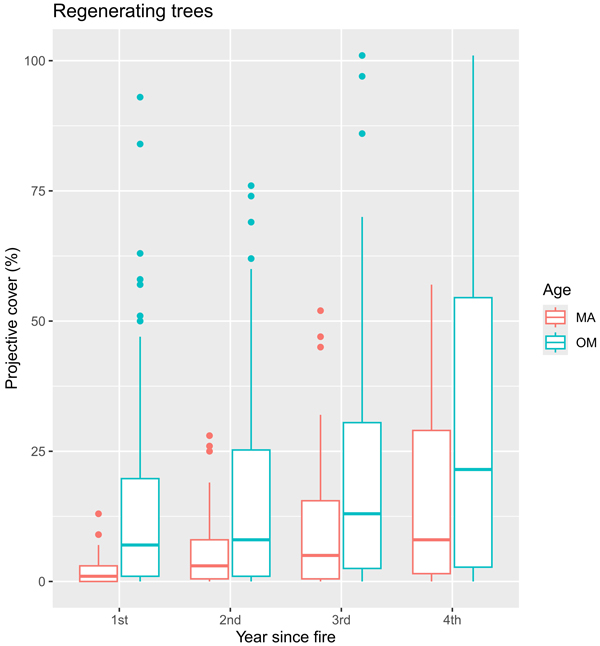
Fig. 8. Boxplots showing the median and the spread of the data with outliers of vegetation projective cover (%) for regenerating trees during four years after fire in sample plots (n = 112). MA – middle-aged stands, OM – over-mature stands.
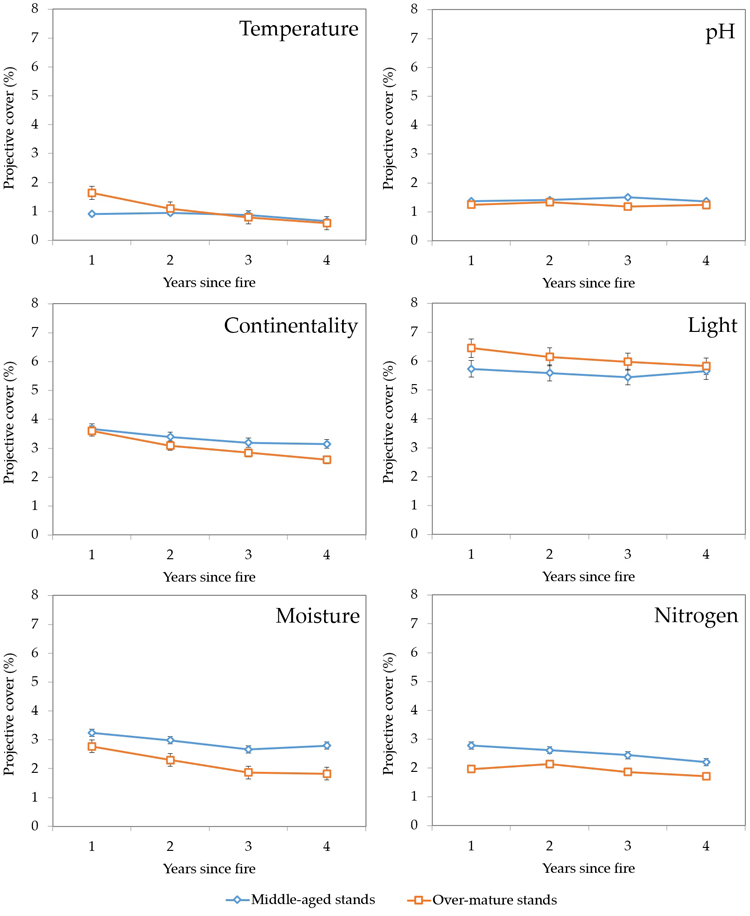
Fig. 9. Changes in average Ellenberg indicator values during four years after fire in sample plots (n = 112). Standard errors are shown.
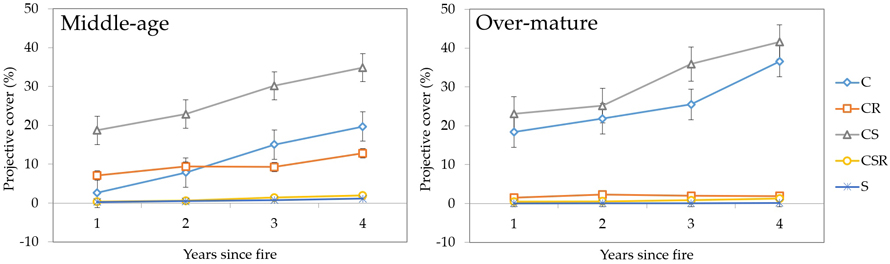
Fig. 10. Changes in vegetation projective cover (%) by C-S-R strategies during four years after fire in sample plots (n = 112). Standard errors are shown.
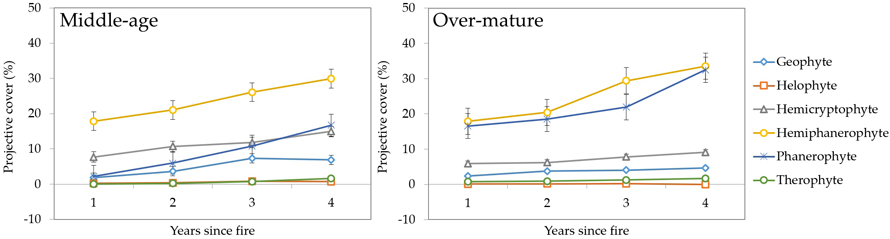
Fig. 11. Changes in vegetation projective cover (%) by Raunkiær life forms during four years after fire in sample plots (n = 112). Standard errors are shown.
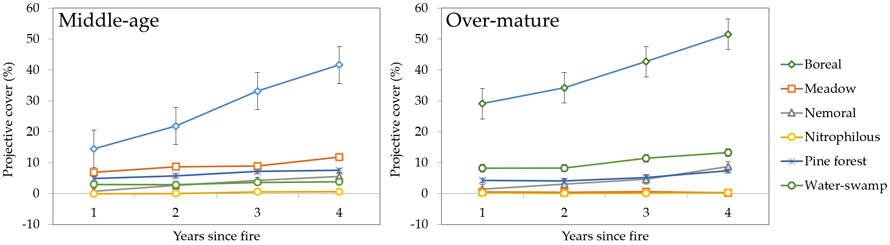
Fig. 12. Changes in vegetation projective cover (%) by plant ecological groups during four years after fire in sample plots (n = 112). Standard errors are shown.
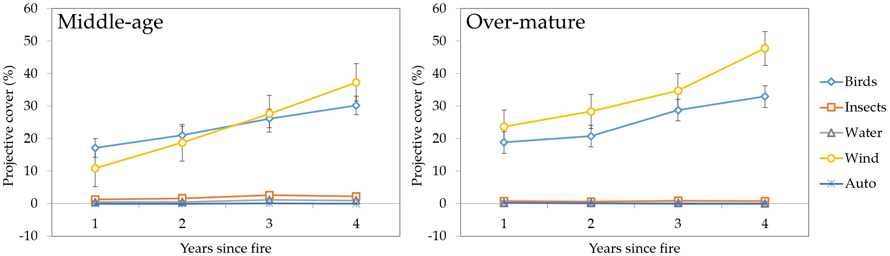
Fig. 13. Changes in vegetation projective cover (%) by seed dispersal agents during four years after fire in sample plots (n = 112). Standard errors are shown.
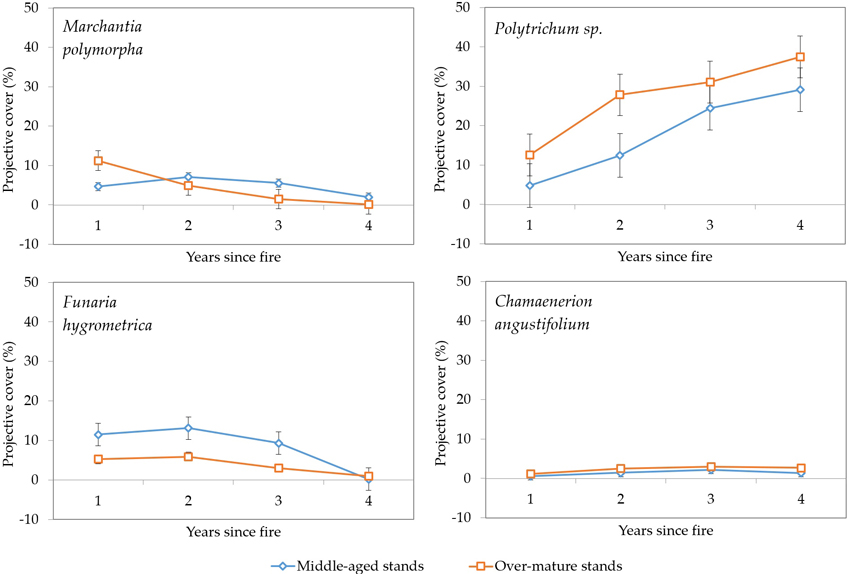
Fig. 14. Changes in vegetation projective cover (%) of four fire-adapted species during four years after fire in sample plots (n = 112). Standard errors are shown.
| Table 2. Species diversity (Shannon-Wiener index H) and standard errors in sample plots (n = 112). | ||||
| Year since fire | ||||
| 1 | 2 | 3 | 4 | |
| Ground layer | ||||
| Middle-aged stands | 1.20 ± 0.09 | 1.31 ± 0.08 | 1.22 ± 0.08 | 0.83 ± 0.08 |
| Over-mature stands | 1.50 ± 0.07 | 1.45 ± 0.06 | 1.23 ± 0.05 | 1.03 ± 0.05 |
| Herb layer | ||||
| Middle-aged stands | 2.00 ± 0.06 | 2.25 ± 0.08 | 2.57 ± 0.10 | 2.56 ± 0.08 |
| Over-mature stands | 2.41 ± 0.08 | 2.50 ± 0.09 | 2.47 ± 0.08 | 2.58 ± 0.07 |
| Tree species regeneration | ||||
| Middle-aged stands | 1.42 ± 0.17 | 1.42 ± 0.11 | 1.44 ± 0.14 | 1.45 ± 0.14 |
| Over-mature stands | 0.99 ± 0.09 | 1.41 ± 0.14 | 1.39 ± 10.14 | 1.53 ± 0.15 |
| Table 3. Vegetation projective cover (%) p-values and significance levels for by layer between successive years since fire event (n = 434). | |||
| Vegetation layer | 1st vs. 2nd year | 2nd vs. 3rd year | 3rd vs. 4th year |
| Ground | 0.003** | 0.542ns | 0.969ns |
| Herb | 0.088* | 0.099* | 0.292ns |
| Tree species regeneration | 0.064* | 0.143ns | 0.083* |
| *** p < 0.001; ** p < 0.05; * p < 0.1; ns – not significant. | |||
| Table 4. p-values and significance levels for vegetation projective cover (%) by age groups (middle-aged and over-mature stands) during the four years since fire event (n = 434). | ||||
| Vegetation layer | 1st year | 2nd year | 3rd year | 4th year |
| Ground | 0.465ns | 0.267ns | 0.683ns | 0.301ns |
| Herb | 0.607ns | 0.393ns | 0.282ns | 0.493ns |
| Tree species regeneration | 0.000*** | 0.011** | 0.035** | 0.049** |
| *** p < 0.001; ** p < 0.05; * p < 0.1; ns – not significant. | ||||