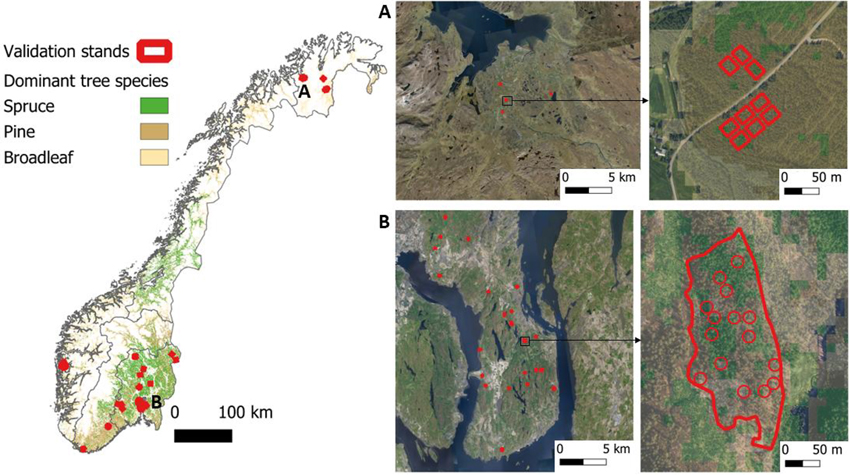
Fig. 1. Overview of the study area and the independent validation datasets. The left side is an overview map of Norway that shows the geographic regions (South-East, Central-South, West, Mid, and North) and the dominant tree species. Red polygons indicate the independent validation stands. The right side shows selected areas (A and B) in higher detail with orthophotos in the background. The maps are in the Universal Transverse Mercator (UTM) coordinate system zone 33. The dominant tree species map is from Kilden (NIBIO 2024), and orthophotos from Geonorge (2024).
| Table 1. Summary statistics of biomass, volume, basal area, and Lorey’s height in the stand-level validation data. The table includes the minimum (min), maximum (max), mean, and standard deviation (sd) for each attribute. Additionally, statistics related to the area of the stands are provided. The total number of validation stands is 65 and the total covered area is 24 hectares. | |||||
| Biomass | Volume | Basal area | Lorey’s height | Area | |
| [Mg ha–1] | [m3 ha–1] | [m2 ha–1] | [m] | [ha] | |
| min | 68.67 | 100.62 | 15.69 | 9.93 | 0.12 |
| max | 583.71 | 984.35 | 71.25 | 30.40 | 1.74 |
| mean | 211.85 | 359.68 | 37.49 | 18.88 | 0.37 |
| sd | 118.28 | 208.88 | 14.41 | 4.46 | 0.29 |
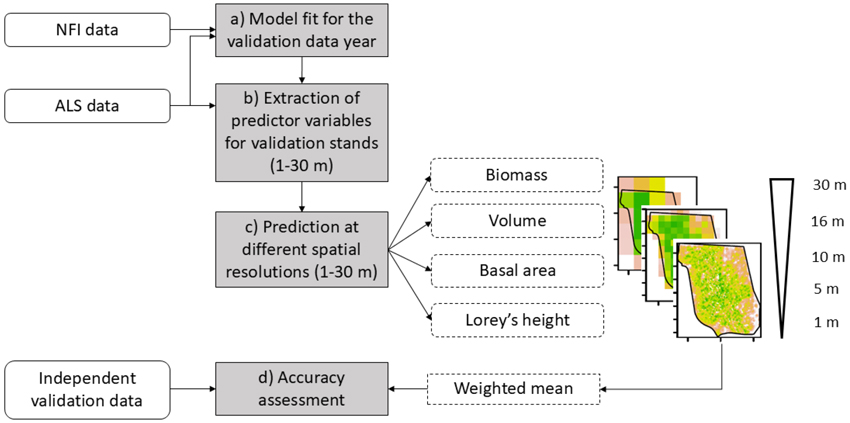
Fig. 2. Overview of the workflow used for assessing the uncertainty of Norwegian forest attribute models predicted at different spatial scales resolutions (1–30 m). The input datasets are indicated with rounded rectangles, the main steps (corresponding to a–d in the main text) are in grey rectangles, and intermediate data and processing steps are indicated with dashed rectangles respectively.
| Table 2. Stand-level RMSE and bias for biomass, volume, basal area, and Lorey’s height, given predictions at different spatial resolutions for independent validation stands. The results for deciduous stands are derived from a limited number of observations (n = 4) and are provided solely for the sake of completeness. | |||||||||
| All species, n = 65 | |||||||||
| Biomass | Volume | Basal area | Lorey’s height | ||||||
| RMSE | bias | RMSE | bias | RMSE | bias | RMSE | bias | ||
| [%] | [%] | [%] | [%] | [%] | [%] | [%] | [%] | ||
| Resolution | 1 | 14.99 | –4.34 | 13.61 | –2.92 | 12.55 | –1.15 | 25.27 | –24.05 |
| 5 | 13.86 | –2.89 | 12.64 | –1.61 | 12.08 | 0.99 | 9.08 | –7.46 | |
| 10 | 14.17 | –3.63 | 12.96 | –2.46 | 11.99 | 0.73 | 6.86 | –3.87 | |
| 16 | 15.21 | –4.42 | 13.93 | –3.41 | 11.97 | 0.10 | 6.87 | –2.38 | |
| 30 | 19.53 | –7.79 | 18.58 | –6.98 | 13.20 | –2.52 | 7.38 | –1.54 | |
| Spruce, n = 30 | |||||||||
| Resolution | 1 | 14.32 | –8.28 | 13.45 | –7.21 | 11.13 | –1.52 | 25.97 | –24.87 |
| 5 | 12.31 | –5.87 | 11.92 | –4.97 | 10.19 | 1.59 | 9.61 | –8.33 | |
| 10 | 12.78 | –6.08 | 12.54 | –5.36 | 10.09 | 1.79 | 6.88 | –4.22 | |
| 16 | 13.81 | –6.61 | 13.47 | –6.01 | 9.98 | 1.50 | 6.91 | –2.45 | |
| 30 | 19.67 | –10.32 | 19.76 | –10.16 | 12.18 | –1.52 | 7.20 | –1.62 | |
| Pine, n = 31 | |||||||||
| Resolution | 1 | 12.88 | 1.79 | 12.49 | 1.99 | 13.39 | –0.77 | 25.72 | –24.8 |
| 5 | 13.45 | 1.82 | 12.27 | 1.97 | 13.13 | 0.35 | 8.61 | –7.18 | |
| 10 | 13.63 | 0.25 | 12.40 | 0.42 | 13.31 | –0.44 | 6.70 | –3.89 | |
| 16 | 14.42 | –0.99 | 13.12 | –0.97 | 12.99 | –1.39 | 6.59 | –2.68 | |
| 30 | 15.65 | –3.98 | 14.67 | –4.14 | 13.67 | –3.74 | 7.40 | –1.86 | |
| Broadleaf, n = 4 | |||||||||
| Resolution | 1 | 18.01 | –4.39 | 13.16 | 4.78 | 16.28 | –0.84 | 14.35 | –12.87 |
| 5 | 18.74 | –3.53 | 14.71 | 5.63 | 17.41 | 0.47 | 7.31 | –3.18 | |
| 10 | 18.45 | –4.38 | 13.27 | 4.93 | 16.31 | 0.19 | 7.14 | –1.26 | |
| 16 | 19.88 | –5.1 | 15.08 | 3.86 | 17.82 | –0.77 | 7.66 | 0.23 | |
| 30 | 19.79 | –7.99 | 12.49 | 2.74 | 16.13 | –2.09 | 8.01 | 1.32 | |
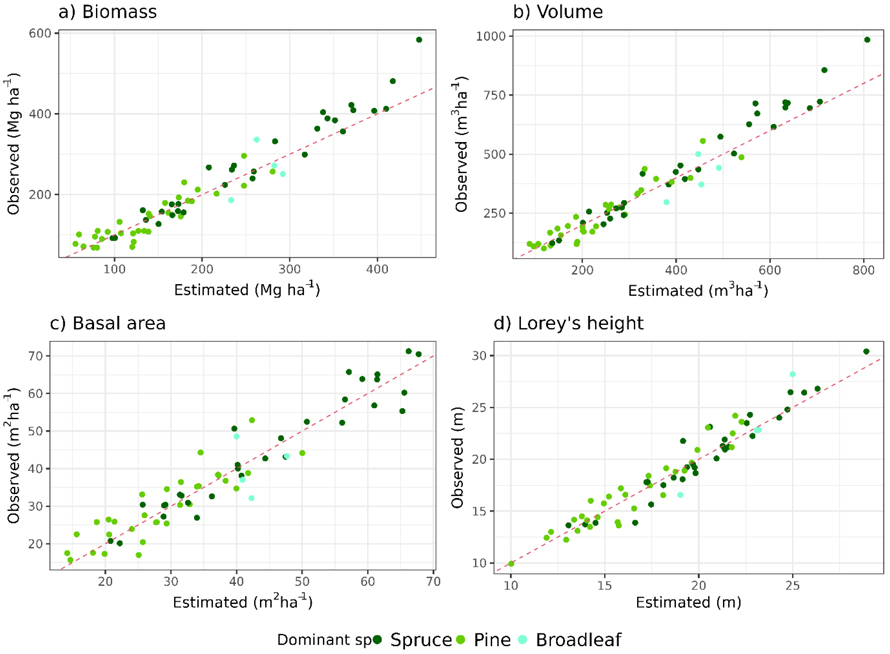
Fig. 3. Observed (field-based) versus estimated (lidar-based) values at the native resolution of the Norwegian forest attribute map at 16 m pixel size for each examined forest attribute (a: biomass, b: volume, c: basal area and d: Lorey’s height). The color of the dots indicates the dominant tree species within the validation stands.
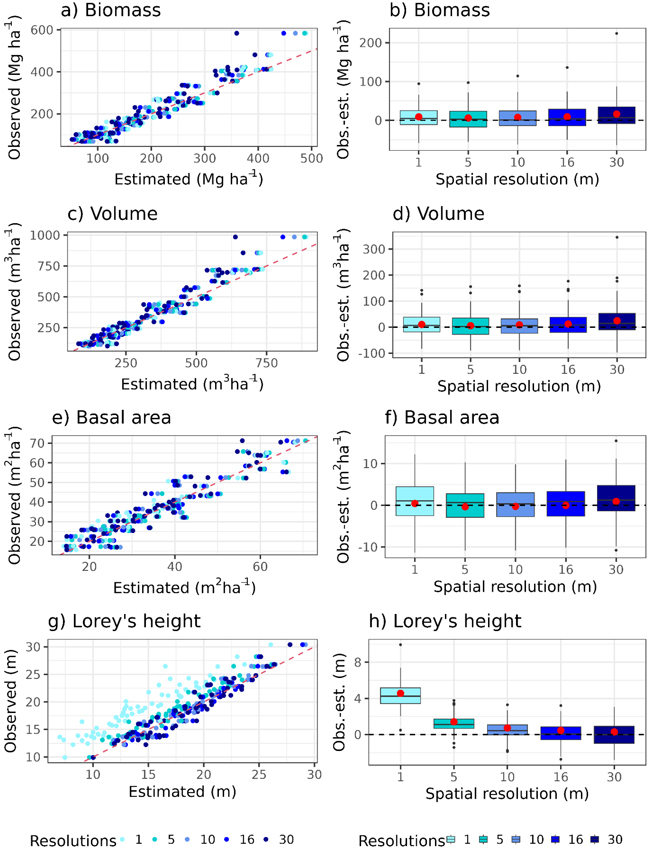
Fig. 4. Right column: Observed (field-based) versus estimated (lidar-based) values across different spatial resolutions for each forest attribute (a: biomass, c: volume, e: basal area, g: Lorey’s height). Left column: Corresponding boxplots illustrate the distribution of the difference between observed and estimated values at each spatial resolution and forest attributes (b: biomass, d: volume, f: basal area, h: Lorey’s height). The red dots indicate the area-weighted mean value of the difference between observed and estimated values.