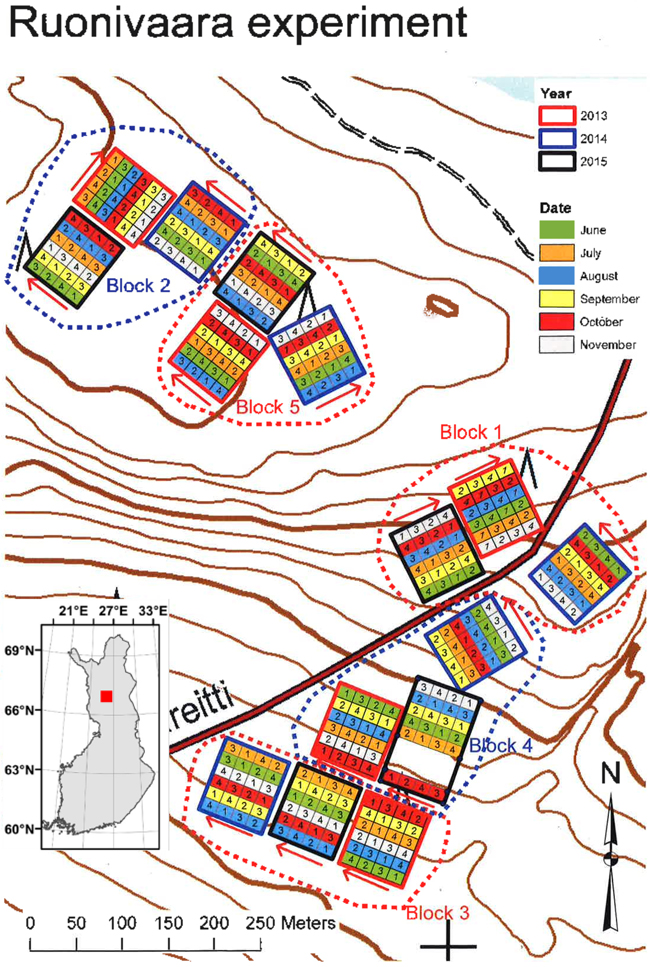
Fig. 1. Location of the experiment and the structure of the experimental design with five blocks divided randomly to annual squares (marked with either black, blue or red borderline) that were further randomly divided into six monthly scarification strips.
| Table 1. Starting date (day/month) of spring, summer, autumn and winter* as well as start and end date of growing season (GS**) in Sodankylä (in Tähtelä, the closest meteorological station of Finnish Meteorological Institute) during 2013–2017. | ||||||
| Year | Spring | Summer | Autumn | Winter | Start of GS | End of GS |
| 2013 | 13/04 | 16/05 | 21/09 | 15/10 | 13/05 | 23/09 |
| 2014 | 11/04 | 29/05 | 13/09 | 10/10 | 19/05 | 20/09 |
| 2015 | 04/04 | 21/06 | 01/09 | 27/10 | 19/05 | 30/09 |
| 2016 | 27/03 | 23/05 | 24/08 | 26/10 | 10/05 | 01/10 |
| 2017 | 29/04 | 07/06 | 23/08 | 19/10 | 09/06 | 07/10 |
| * Definitions: mean daily temperature during spring 0 – +10 °C; summer > +10 °C; autumn +10–0 °C and winter < 0 °C ** The mean daily temperature > +5 °C | ||||||
| Table 2. Explanatory variables (measured in the vicinity of seeding points) that have been tested in the models and their distributions. In addition to the variables mentioned in the table, seed type (Scots pine, lodgepole pine and stratified lodgepole pine), seeding month and inventory number were tested as the main important variables in the models. | ||||
| Variable | Minimum | Maximum | Mean | Median |
| Continuous variables | ||||
| Thickness of humus layer, cm | 1.00 | 7.00 | 2.47 | 2.00 |
| Stoniness, (depth of an iron stick in the ground) | 0.00 | 52.00 | 9.49 | 7.00 |
| Proportion of untouched humus or vegetation, % | 0.00 | 50.00 | 0.38 | 0.00 |
| Proportion of mixed humus and mineral soil, % | 0.00 | 100.00 | 14.85 | 10.00 |
| Proportion of exposed mineral soil, % | 0.00 | 100.00 | 82.58 | 90.00 |
| Categorical variables | ||||
| Soil type | n | % | ||
| Gravel | 1174 | 34.55 | ||
| Sand | 1926 | 56.68 | ||
| Silt | 298 | 8.77 | ||
| Microtopography (seeding point compared to surroundings) | ||||
| Upper | 1349 | 39.70 | ||
| Same | 1949 | 57.36 | ||
| Lower | 100 | 2.94 | ||
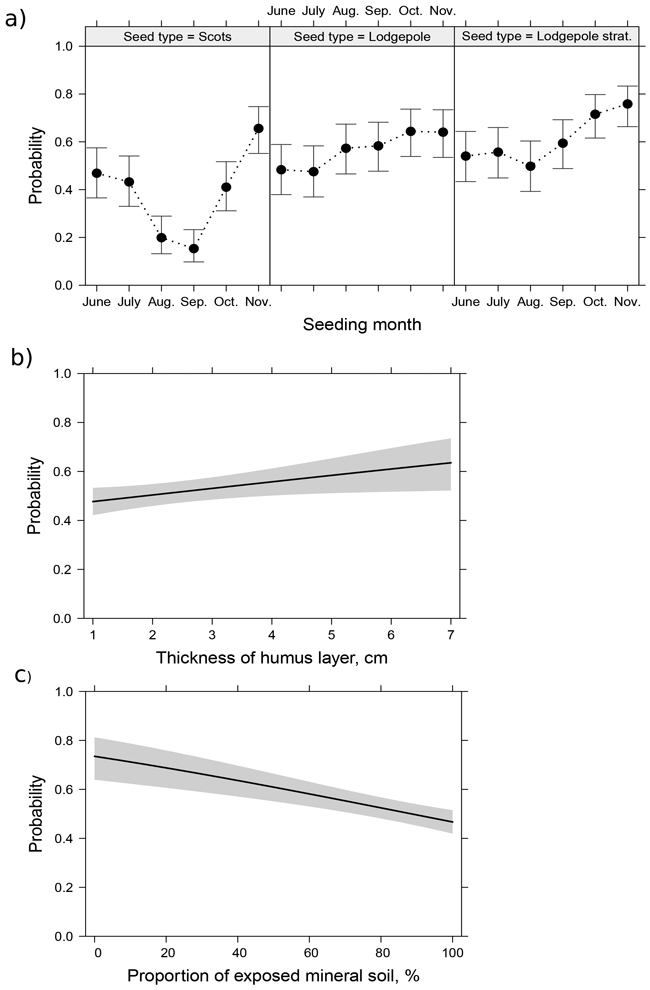
Fig. 2. Predictions (with 95% confidence intervals) for the logistic mixed effects model predicting the probability of observing at least one seedling on the seeding point seeded in different months at the time of the last inventory (Model 1, Table 3). Predictions were computed for the interaction of seed type and seeding month (a), thickness of humus layer (b) and proportion of exposed mineral soil (c). Seed type abbreviations are: Scots as Scots pine, Lodgepole as lodgepole pine and Lodgepole strat. as stratified seeds of lodgepole pine.
| Table 3. Parameter estimates and tests of the logistic mixed effects model (Model 1) for the observed seedling on the seeding point in the last inventory. Lodgepole denotes Lodgepole pine and strat. stratified seed. Classification efficiency (ROC) = 68.15 % (marginal model). Interaction effects are separated with : and reference category is expressed as (ref.) | |||||
| Variable / parameter | Estimate | Std.error | df | t- or χ2-value | p |
| Fixed effects | |||||
| Intercept | 5.573E-01 | 3.329E-01 | 2427 | 1.674 | 0.094 |
| Month (ref. June) | - | - | 5 | 69.327 | < 0.001 |
| July | –1.471E-01 | 2.970E-01 | 70 | –0.495 | 0.622 |
| August | –1.267E+00 | 3.194E-01 | 70 | –3.967 | < 0.001 |
| September | –1.583E+00 | 3.285E-01 | 70 | –4.820 | < 0.001 |
| October | –2.373E-01 | 2.951E-01 | 70 | –0.804 | 0.424 |
| November | 7.708E-01 | 2.984E-01 | 70 | 2.583 | 0.012 |
| Seed type (ref. Scots pine) | - | - | 2 | 1.225 | 0.542 |
| Lodgepole | 5.861E-02 | 2.742E-01 | 168 | 0.214 | 0.831 |
| Lodgepole, strat. | 2.873E-01 | 2.752E-01 | 168 | 1.044 | 0.298 |
| Depth of humus layer, cm | 1.079E-01 | 4.925E-02 | 2427 | 2.192 | 0.029 |
| Exposed mineral soil % | –1.153E-02 | 2.554E-03 | 2427 | –4.517 | < 0.001 |
| Month:Seedtype | - | - | 10 | 51.762 | < 0.001 |
| July:Lodgepole | 1.145E-01 | 3.922E-01 | 168 | 0.292 | 0.771 |
| August:Lodgeople | 1.628E+00 | 4.093E-01 | 168 | 3.978 | < 0.001 |
| September:Lodgepole | 1.985E+00 | 4.149E-01 | 168 | 4.785 | < 0.001 |
| October:Lodgepole | 8.961E-01 | 3.920E-01 | 168 | 2.286 | 0.024 |
| November:Lodgepole | –1.267E-01 | 3.947E-01 | 168 | –0.321 | 0.749 |
| July:Lodgepole strat. | 2.141E-01 | 3.928E-01 | 168 | 0.545 | 0.586 |
| August:Lodgepole strat. | 1.096E+00 | 4.089E-01 | 168 | 2.682 | 0.008 |
| September:Lodgepole strat | 1.803E+00 | 4.163E-01 | 168 | 4.332 | < 0.001 |
| October:Lodgepole strat | 9.972E-01 | 3.968E-01 | 168 | 2.513 | 0.013 |
| November:Lodgepole strat | 2.112E-01 | 4.036E-01 | 168 | 0.523 | 0.602 |
| Random effects | |||||
| Block (level 1) | 2.863E-03 | ||||
| Annual square (level 2) | 0.060 | ||||
| Scarification strip (level 3) | 0.081 | ||||
| Seeding square (level 4) | 0.163 | ||||
| Dispersion parameter | 0.945 | ||||
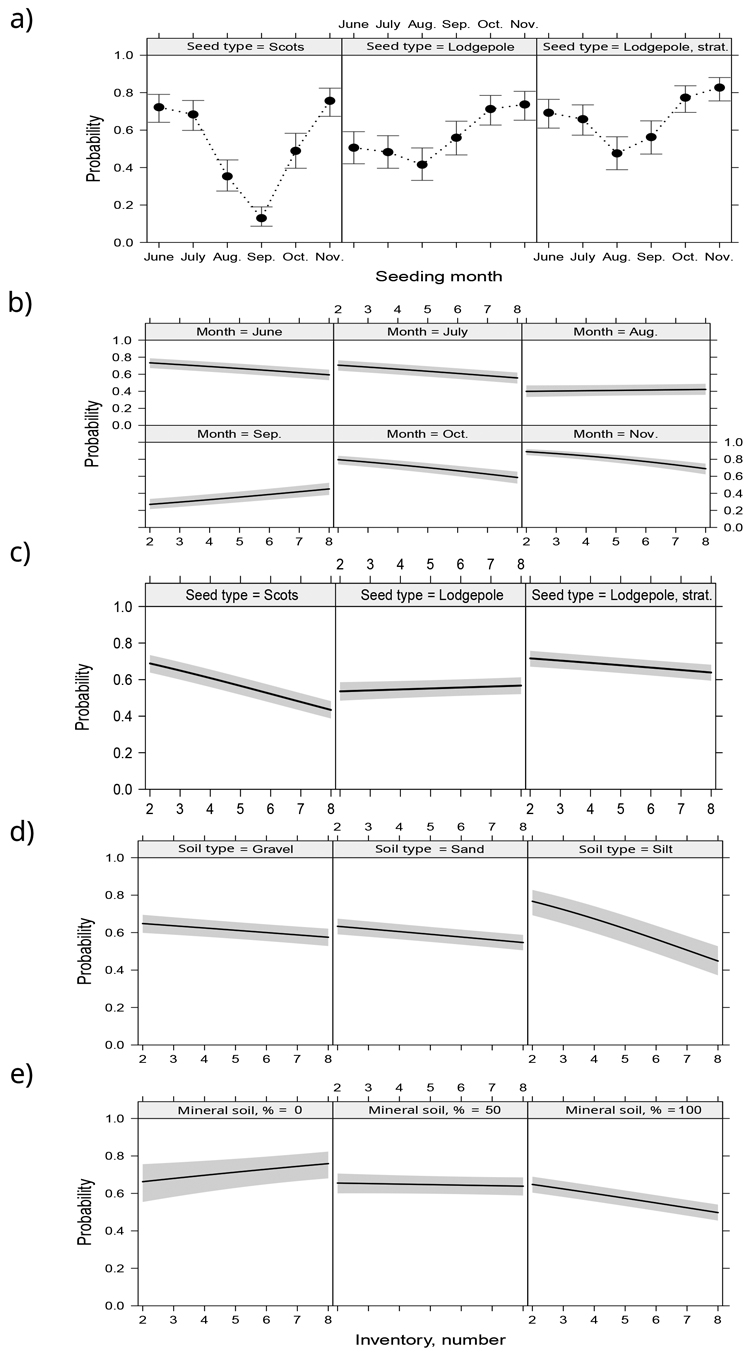
Fig. 3. Predictions (with 95% confidence intervals) for the logistic mixed effects model predicting the probability of observing a seedling on the seeding point in different inventories (Model 2, Table 4). Predictions were computed for the interaction of seeding month and seed type (a), the interaction of the number of inventory (time series) and seeding month (b), the interaction of the number of inventory and seed type (c), the interaction of the number of inventory and the soil type of seeding point (d) and the interaction of the number of inventory and the proportion of exposed mineral soil (e). Seed type abbreviations: see Fig. 2.
| Table 4. Parameter estimates and tests of the logistic mixed effects model (Model 2) with autoregressive (AR(1)) error term for the probability of at least one seedling on the seeding point at the certain point and time of inventory. Lodgepole denotes Lodgepole pine and strat. stratified seed. Classification efficiency (ROC) = 70.25 % (marginal model). Interaction effects are separated with : and reference category is expressed as (ref.). | |||||
| Variable / parameter | Estimate | Std.error | df | t- or χ2-value | p |
| Fixed effects | |||||
| Intercept | 1.910E+00 | 3.524E-01 | 19641 | 5.421 | 0.000 |
| Month (ref. June) | - | - | 5 | 307.592 | < 0.001 |
| July | –1.701E-01 | 2.938E-01 | 70 | –0.579 | 0.564 |
| August | –2.283E+00 | 2.883E-01 | 70 | –7.919 | 0.000 |
| September | –4.274E+00 | 3.238E-01 | 70 | –13.200 | 0.000 |
| October | –6.333E-01 | 3.004E-01 | 70 | –2.108 | 0.039 |
| November | 8.189E-01 | 3.339E-01 | 70 | 2.453 | 0.017 |
| Seed type (ref. Scots pine) | - | - | 2 | 72.124 | < 0.001 |
| Lodgepole | –2.102E+00 | 2.525E-01 | 168 | –8.326 | 0.000 |
| Lodgepole, strat. | –8.372E-01 | 2.603E-01 | 168 | –3.216 | 0.002 |
| Soil type (ref. Gravel) | - | - | 2 | 18.364 | < 0.001 |
| Sand | –4.712E-02 | 1.240E-01 | 2426 | –0.380 | 0.704 |
| Silt | 9.441E-01 | 2.405E-01 | 2426 | 3.926 | 0.000 |
| Inventory | –4.079E-02 | 3.553E-02 | 19641 | –1.148 | 0.251 |
| Exposed mineral soil % | 2.985E-03 | 3.142E-03 | 19641 | 0.950 | 0.342 |
| Month:Seedtype | - | - | 10 | 118.994 | < 0.001 |
| July:Lodgepole | 9.186E-02 | 3.092E-01 | 168 | 0.297 | 0.767 |
| August:Lodgeople | 1.195E+00 | 3.134E-01 | 168 | 3.814 | 0.000 |
| September:Lodgepole | 3.072E+00 | 3.429E-01 | 168 | 8.959 | 0.000 |
| October:Lodgepole | 1.883E+00 | 3.256E-01 | 168 | 5.782 | 0.000 |
| November:Lodgepole | 8.297E-01 | 3.364E-01 | 168 | 2.466 | 0.015 |
| July:Lodgepole strat. | 2.940E-02 | 3.151E-01 | 168 | 0.093 | 0.926 |
| August:Lodgepole strat. | 6.514E-01 | 3.161E-01 | 168 | 2.061 | 0.041 |
| September:Lodgepole strat | 2.297E+00 | 3.454E-01 | 168 | 6.650 | 0.000 |
| October:Lodgepole strat | 1.414E+00 | 3.350E-01 | 168 | 4.221 | 0.000 |
| November:Lodgepole strat | 5.755E-01 | 3.494E-01 | 168 | 1.647 | 0.102 |
| Month:Inventory | - | - | 5 | 224.052 | < 0.001 |
| July:Inventory | –2.612E-03 | 1.947E-02 | 19641 | –0.134 | 0.893 |
| August:Inventory | 1.219E-01 | 2.027E-02 | 19641 | 6.015 | 0.000 |
| September:Inventory | 2.393E-01 | 2.289E-02 | 19641 | 10.452 | 0.000 |
| October:Inventory | –6.174E-02 | 2.457E-02 | 19641 | –2.513 | 0.012 |
| November:Inventory | –1.084E-01 | 2.763E-02 | 19641 | –3.923 | 0.000 |
| Seedtype:Inventory | - | - | 2 | 140.230 | < 0.001 |
| Lodgepole:Inventory | 1.976E-01 | 1.670E-02 | 19641 | 11.827 | 0.000 |
| Lodgepole_strat:Inventory | 1.171E-01 | 1.711E-02 | 19641 | 6.845 | 0.000 |
| Soiltype:Inventory | - | - | 2 | 39.274 | < 0.001 |
| Sand:Inventory | –8.518E-03 | 1.474E-02 | 19641 | –0.578 | 0.563 |
| Silt:Inventory | –1.819E-01 | 2.975E-02 | 19641 | –6.113 | 0.000 |
| Inventory:Exposed mineral soil, % | –1.819E-03 | 3.751E-04 | 19641 | –4.850 | 0.000 |
| Random effects, AR(1) | |||||
| Block (level 1) | 4.345E-18 | ||||
| Annual square (level 2) | 0.052 | ||||
| Scarification strip (level 3) | 0.089 | ||||
| Seeding square (level 4) | 0.105 | ||||
| Seeding point (level 5) | 1.962E-06 | ||||
| Dispersion parameter | 0.993 | ||||
| Phi | 0.831 | ||||