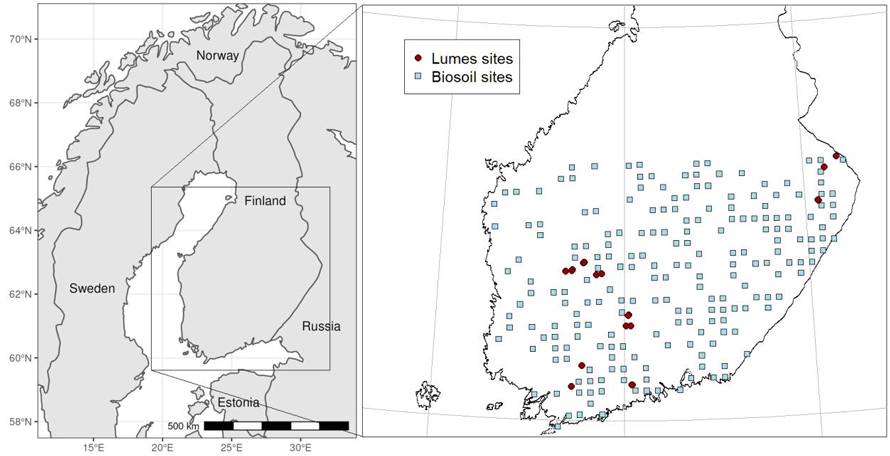
Fig. 1. The locations of the 27 unmanaged Lumes-sites and 206 managed Biosoil-sites that were used for this study. Note that there is some overlap with some of the unmanaged sites.
| Table 1. The main characteristics of the standing stock of all the trees in the study sites, with the exception of Dominant species and age that are based on maximum relative basal area. Note that sites PA6C and PA122 are missing from this table as they were not included in the Akujärvi el al. (2025) data. | |||||||
| Site | Height (m) | DBH (cm) | Dominant age (years) | Basal area m2 | Volume m3 | Dominant species | Crown cover |
| JO101 | 22.6 | 26.3 | 175 | 40 | 436 | Picea abies | 57% |
| JO124 | 22.7 | 25.8 | 173 | 41 | 440 | Picea abies | 51% |
| JO135 | 24.8 | 27.8 | 183 | 34 | 390 | Picea abies | 46% |
| JO144 | 24.3 | 22.4 | 123 | 41 | 415 | Picea abies | 65% |
| PA121 | 24.6 | 29.6 | 167 | 33 | 404 | Picea abies | 31% |
| PA131 | 22.9 | 33.2 | 159 | 26 | 297 | Pinus sylvestris | 32% |
| PA132 | 22.9 | 27.4 | 165 | 31 | 342 | Picea abies | 42% |
| PA6 | 24.6 | 26.9 | 161 | 40 | 412 | Picea abies | 46% |
| PA61 | 25.2 | 31.4 | 127 | 65 | 827 | Pinus sylvestris | 56% |
| PA62 | 24.6 | 30.7 | 124 | 55 | 688 | Pinus sylvestris | 50% |
| PA63 | 23.5 | 31.9 | 110 | 58 | 696 | Pinus sylvestris | 55% |
| PA67 | 22.8 | 24.9 | 189 | 28 | 326 | Picea abies | 40% |
| PA7 | 24.3 | 28.3 | 161 | 41 | 446 | Picea abies | 57% |
| PA8 | 25.1 | 30.6 | 156 | 35 | 323 | Picea abies | 46% |
| VA101 | 32.0 | 34.7 | 184 | 27 | 426 | Picea abies | 28% |
| VA109 | 24.1 | 26.7 | 155 | 45 | 544 | Picea abies | 49% |
| VA112 | 22.5 | 18.8 | 168 | 34 | 358 | Picea abies | 57% |
| VA207 | 25.3 | 19.7 | 153 | 20 | 244 | Picea abies | 32% |
| VA209 | 27.6 | 26.8 | 154 | 38 | 433 | Picea abies | 48% |
| VA210 | 28.6 | 31.3 | 171 | 37 | 493 | Pinus sylvestris | 45% |
| VA211 | 27.5 | 24.8 | 133 | 24 | 332 | Picea abies | 31% |
| VA222 | 29.2 | 29.1 | 159 | 36 | 505 | Picea abies | 37% |
| VA228 | 22.9 | 20.5 | 95 | 30 | 335 | Picea abies | 48% |
| VA401 | 26.7 | 31.1 | 200 | 45 | 513 | Picea abies | 51% |
| VA403 | 27.6 | 33.4 | 228 | 44 | 570 | Picea abies | 44% |
| Table 2. The main characteristics of the managed stands of Biosoil at similar sites by main tree species and age classes. | ||||||||||||
| Age class | Average basal area (m2) | Average height (m) | Number of sites | |||||||||
| Pine | Spruce | Decid. | All | Pine | Spruce | Decid. | All | Pine | Spruce | Decid. | Sum all | |
| 0–19 | 7 | 1 | 2 | 3 | 4.8 | 2.7 | n/a | 4.3 | 8 | 9 | 17 | 34 |
| 20–39 | 23 | 20 | 19 | 21 | 11.9 | 13.1 | 18.8 | 12.8 | 10 | 11 | 5 | 26 |
| 40–59 | 21 | 24 | 22 | 23 | 17.3 | 18.3 | 18.7 | 17.9 | 16 | 19 | 10 | 45 |
| 60–79 | 28 | 28 | 24 | 28 | 23.3 | 22.3 | 22.4 | 22.5 | 5 | 31 | 3 | 39 |
| 80–99 | 26 | 27 | 36 | 27 | 21.8 | 23.7 | n/a | 23.3 | 7 | 23 | 1 | 31 |
| 100–119 | 24 | 27 | 18 | 25 | 21.5 | 23.9 | n/a | 23.3 | 6 | 13 | 1 | 20 |
| 120–140 | 13 | 27 | n/a | 26 | 13.4 | 24.4 | n/a | 23.2 | 1 | 8 | 0 | 9 |
| All | 21 | 24 | 13 | 21 | 16.5 | 20.9 | 19.4 | 19.5 | 53 | 114 | 37 | 204 |
| Table 3. The mean concentrations of soil carbon and nitrogen for samples from the different soil layers in the unmanaged Lumes-sites with their corresponding standard deviations and the number of samples. Note that this analysis only includes soil particles smaller than 2 mm. | ||||||
| Layer | Carbon | Nitrogen | ||||
| g kg–1 | Std. deviation | n | g kg–1 | Std. deviation | n | |
| Organic layer | 408.43 | 78.57 | 431 | 13.46 | 2.96 | 431 |
| Mineral soil 0–10 cm | 36.76 | 28.74 | 432 | 1.44 | 0.90 | 384 |
| Mineral soil 10–20 cm | 18.40 | 11.73 | 211 | 0.83 | 0.51 | 187 |
| Table 4. The mean, minimum and maximum values of carbon and nitrogen (kg m–2) of different layers for the soil samples measured from the unmanaged Lumes-sites, along with the values from similar sites from the managed Biosoil-data. | ||||||||||
| Organic layer | Mineral layer 0–10 cm | Mineral layer 10–20 cm | ||||||||
| Mean | Min | Max | Mean | Min | Max | Mean | Min | Max | ||
| Carbon | Biosoil | 2.058 | 0.210 | 7.956 | 1.777 | 0.114 | 5.247 | 1.141 | 0.092 | 5.552 |
| Lumes | 2.581 | 1.071 | 7.955 | 2.442 | 1.684 | 3.353 | 1.621 | 0.863 | 2.528 | |
| Nitrogen | Biosoil | 0.081 | 0.008 | 0.329 | 0.091 | 0.005 | 0.350 | 0.064 | 0.005 | 0.320 |
| Lumes | 0.087 | 0.038 | 0.364 | 0.097 | 0.067 | 0.180 | 0.074 | 0.030 | 0.128 | |
| Table 5. The results of t-tests of the mean values (kg m–2) of the three layers between the managed Biosoil-dataset and the new unmanaged Lumes results. | ||||||
| Layer | Carbon | Nitrogen | ||||
| t | df | p-value | t | df | p-value | |
| Org layers | –1.504 | 31.013 | 0.143 | –0.560 | 28.990 | 0.580 |
| 0–10 mineral layers | –9.071 | 58.181 | <0.001 | –4.647 | 48.87 | <0.001 |
| 10–20 mineral layers | –6.332 | 41.07 | <0.001 | –3.886 | 32.811 | <0.001 |
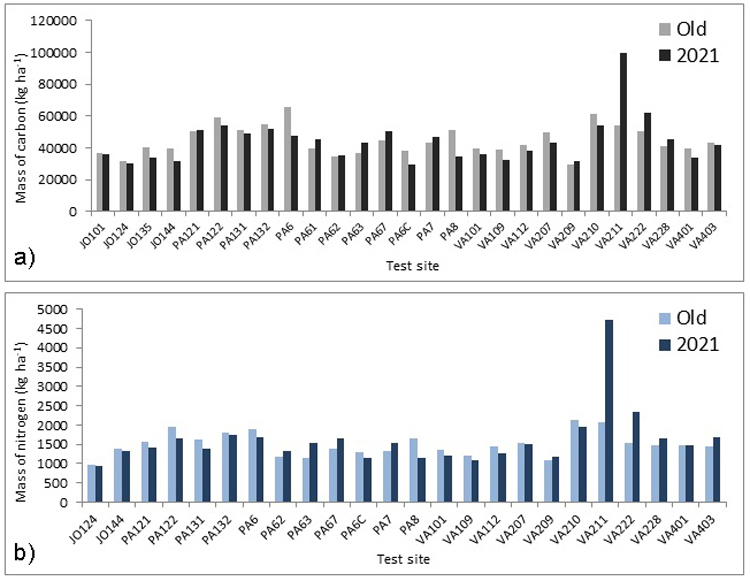
Fig. 2. (a) The mass of carbon (kg ha–1) in the organic layer and the top 10 cm of the mineral soil and (b) the mass of nitrogen (kg ha–1) in the organic layer and the top 10 cm of the mineral soil. The “Old” refers to year 2001, 2002 or 2003. Note that three sites are excluded from the figure 2 (b).