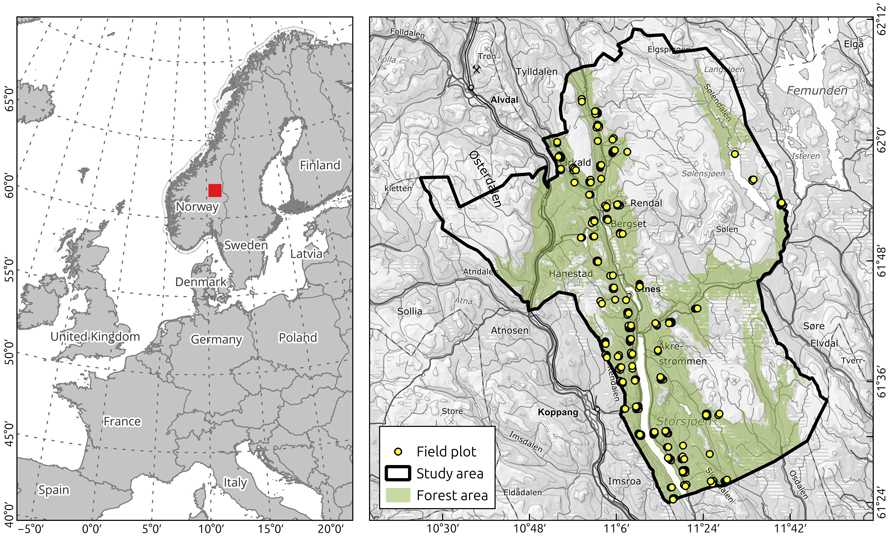
Fig. 1. Location of study area, Rendalen municipality, Innlandet county, eastern Norway, and distribution of field plots.
| Table 1. Number of plots (n), mean values ( | ||||||
| Acquisition year | Stratum | n | m3 ha–1 | m2 ha–1 | m | m |
| 2015 | 1 | 72 | 187 (114) | 24.4 (11.1) | 15.5 (3.4) | 19.0 (3.6) |
| 2015 | 2 | 80 | 135 (95) | 17.4 (10.2) | 15.2 (3.4) | 17.4 (3.7) |
| 2015 | 3 | 78 | 119 (87) | 17.6 (10.1) | 12.4 (2.9) | 15.3 (3.4) |
| 2015 | All | 230 | 146 (103) | 19.7 (10.4) | 14.3 (3.2) | 17.2 (3.6) |
| 2018 | 1 | 15 | 206 (118) | 25.8 (11.9) | 16.7 (2.7) | 19.5 (3.1) |
| 2018 | 2 | 12 | 204 (105) | 24.4 (9.9) | 17.2 (3.1) | 19.7 (3.0) |
| 2018 | 3 | 18 | 150 (80) | 21.3 (9.3) | 13.4 (2.3) | 16.7 (2.5) |
| 2018 | All | 45 | 183 (102) | 23.6 (10.3) | 15.5 (3.2) | 18.4 (3.1) |
| Table 2. Occurance of different types of metrics in the models, percentages of models having one and two explanatory variables, and the range of accuray expressed as relative RMSE. The results are distributed between point cloud types and response variable categories (Vars) grouping the density dependent G and V together as well as the height variables (HL and HO). | ||||||||||
| Point cloud type | Vars | Occurance of metrics (%) *1 | Number of metrics (%) *2 | Range in accuracy (%) | ||||||
| Density metrics | Heigh percentiles | Mom. Stat. *7 | ||||||||
| Lower range *3 | Upper range *4 | Lower range *5 | Upper range *6 | One | Two | Min RMSE | Max RMSE | |||
| Image | G, V | 15 | 21 | 13 | 43 | 8 | 47 | 53 | 21.3 | 40.2 |
| ALS | G, V | 38 | 13 | 8 | 21 | 21 | 0 | 100 | 19.3 | 25.7 |
| Image | HL, HO | 11 | 5 | 8 | 66 | 11 | 73 | 27 | 9.2 | 16.3 |
| ALS | HL, HO | 25 | 0 | 0 | 75 | 0 | 67 | 33 | 8.7 | 11.5 |
| *1: The numbers are percentages of the total number of metrics selected for the models represented on each line in the table. *2: The numbers are percentages of the total number of models represented on each line in the table. *3: D0–D4. *4: D5–D9. *5: H10–H50. *6: H60–Hmax. *7: Moment statistics (Hmean, Hsd, Hcv, Hkurt, Hskewness) | ||||||||||
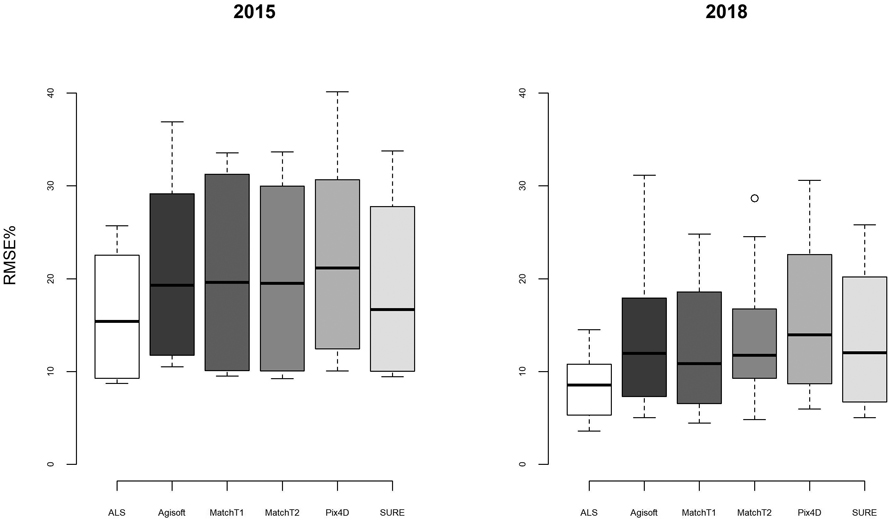
Fig. 2. Distributions of RMSE% associated with models constructed using explanatory variables calculated from different point cloud types on the 2015 (left panel) and 2018 datasets (right panel).
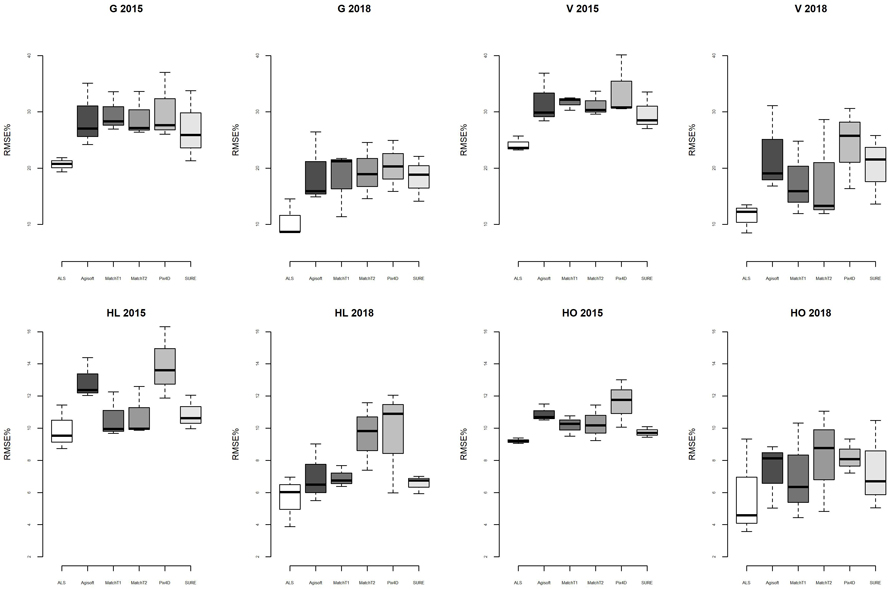
Fig. 3. Distributions of RMSE% specific to each response variable associated with models constructed using explanatory variables calculated from different point cloud types (labels on x-axes) on the 2015 and 2018 datasets. View larger in new window/tab.
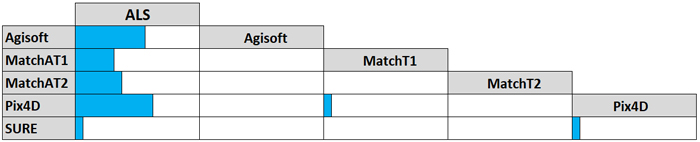
Fig. 4. Summary of Tukey HSD tests of |rD| resulting from comparing predictions from different point cloud types on different subsets of data. Bars indicate the proportion of 16 tests that identified statistically significant differences in |rD| among all combinations of point cloud types separately for the two acquisition years.