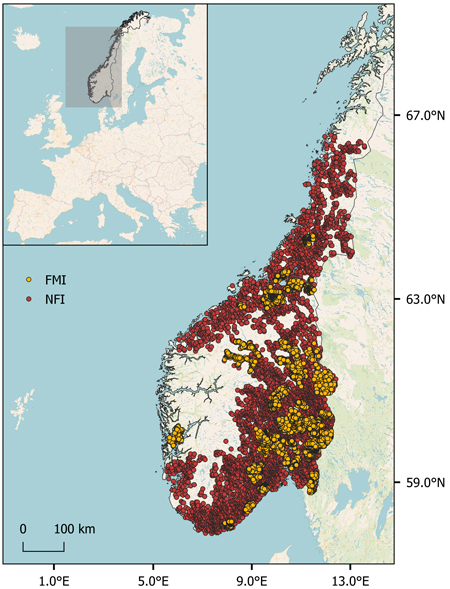
Fig. 1. Locations of circular sample plots of 250 m2 measured as part of the Norwegian national forest inventory (NFI, n = 5625) and 45 local forest management inventories (FMI, n = 6795) in Norway.
| Table 1. Summary of tree diameters at breast height (dbh) and heights, and plot-level volume, Lorey’s mean height, and dominant height across the three strata. | |||
| Range | Mean | Standard deviation | |
| Stratum 1 - Younger production forest (144 210 trees, 3714 plots) | |||
| Tree dbh (cm) | 4.0–78.0 | 12.0 | 6.0 |
| Tree height (m) | 1.4–38.1 | 9.9 | 4.2 |
| Tree volume (m3) | 0.0–3.5 | 0.1 | 0.1 |
| Plot volume (m3 ha–1) | 1–719 | 138 | 88 |
| Plot Lorey’s mean height (m) | 4.8–24.7 | 11.3 | 2.4 |
| Plot dominant height (m) | 3.6–38.1 | 15.7 | 4.1 |
| Stratum 2 - Mature forest, spruce-dominated (161 148 trees, 5387 plots) | |||
| Tree dbh (cm) | 4–83.7 | 15.4 | 8.7 |
| Tree height (m) | 1.4–42.6 | 12.0 | 5.7 |
| Tree volume (m3) | 0.0–5.9 | 0.2 | 0.3 |
| Plot volume (m3 ha–1) | 0–1023 | 226 | 144 |
| Plot Lorey’s mean height (m) | 4.3–32.0 | 14.4 | 3.7 |
| Plot dominant height (m) | 4–42.6 | 19.4 | 5.2 |
| Stratum 3 - Mature forest, pine-dominated (69 023 trees, 3318 plots) | |||
| Tree dbh (cm) | 4–97 | 17.0 | 9.7 |
| Tree height (m) | 1.4–33 | 12.1 | 5.4 |
| Tree volume (m3) | 0.0–5.5 | 0.2 | 0.3 |
| Plot volume (m3 ha–1) | 5–1162 | 184 | 110 |
| Plot Lorey’s mean height (m) | 6.6–25.6 | 14.2 | 3.1 |
| Plot dominant height (m) | 5.6–32.2 | 17.6 | 4.1 |
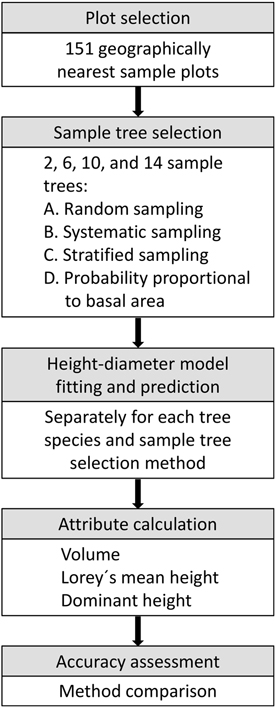
Fig. 2. Analyses performed in each Monte Carlo replication to assess the effects of sample tree selection methods and calculation methods on accuracies of field plot values.
| Table 2. Root mean square errors (RMSE%) and mean differences (MD%) between field-measured tree heights and the mean of the 100 corresponding imputed heights, relative to the mean field-measured height obtained for sample trees across species and strata (forest types). | ||||||
| Stratum | ||||||
| 1 | 2 | 3 | ||||
| RMSE% | MD% | RMSE% | MD% | RMSE% | MD% | |
| Spruce | 17.1 | 0.0 | 17.8 | –0.3 | 17.9 | –0.2 |
| Pine | 18.1 | –0.5 | 17.6 | –0.6 | 19.8 | –0.4 |
| Deciduous | 20.8 | –0.4 | 22.7 | –0.2 | 21.2 | 0.1 |
| Table 3. Mean values of root mean square errors relative to the observed mean values (RMSE%), and mean differences (MD%) in parentheses, obtained for the calculated field plot values in the Monte Carlo simulation in which we sampled 151 plots in each replication, and compared numbers of sample trees, sample tree selection methods and calculation methods. | |||
| Volume (m3 ha–1) | Lorey’s mean height (m) | Dominant height (m) | |
| Number of sample trees | |||
| 2 | 11.6 (1.5) | 12.8 (–1.1) | 15.8 (3.8) |
| 6 | 7.9 (0.5) | 7.7 (–0.6) | 10.8 (0.4) |
| 10 | 6 (0.3) | 6.1 (–0.3) | 8.2 (–0.2) |
| 14 | 5 (0.2) | 5.3 (–0.1) | 6.7 (–0.4) |
| Sample tree selection method* | |||
| A | 8.7 (–0.2) | 9.3 (0.1) | 15.6 (2.4) |
| B | 7.5 (1.4) | 7.6 (–1.5) | 8.2 (0.4) |
| C | 7.5 (1.4) | 7.6 (–1.6) | 8.2 (0.4) |
| D | 6.7 (0.1) | 7.5 (0.9) | 9.5 (0.4) |
| Calculation method** | |||
| I | 8.2 (0.6) | 12.4 (–1.3) | 12.4 (–3) |
| II | 6.5 (0.7) | 7.5 (–1) | 7.4 (–1.2) |
| III | 8.1 (0.6) | 5.1 (–0.1) | 13.3 (7.4) |
| IV | 7.6 (0.8) | 6.9 (0.3) | 10.8 (2) |
| V | - (-) | - (-) | 7.9 (–0.7) |
| *A = random sampling; B = systematic sampling, where every nth tree was selected, C = stratified sampling from dbh classes; D = sampling with a probability proportional to basal area. **For volume: I = allometric models; II = method I, retaining reference volumes of sample trees; III = ratio estimation; IV = method III, retaining reference volumes of sample trees. For Lorey’s mean height: I = (basal area-weighted) mean height of sample trees; II = basal area-weighted mean predicted height; III = method II, retaining sample tree heights; IV = model-assisted estimation. For dominant height: I = mean predicted height of the two largest trees; II = method I, retaining sample tree heights; III = mean height of the two largest sample trees; IV = height of the largest sample tree(s); V = mean predicted height of the two largest trees, corrected with the ratio between reference- and predicted sample tree heights. | |||
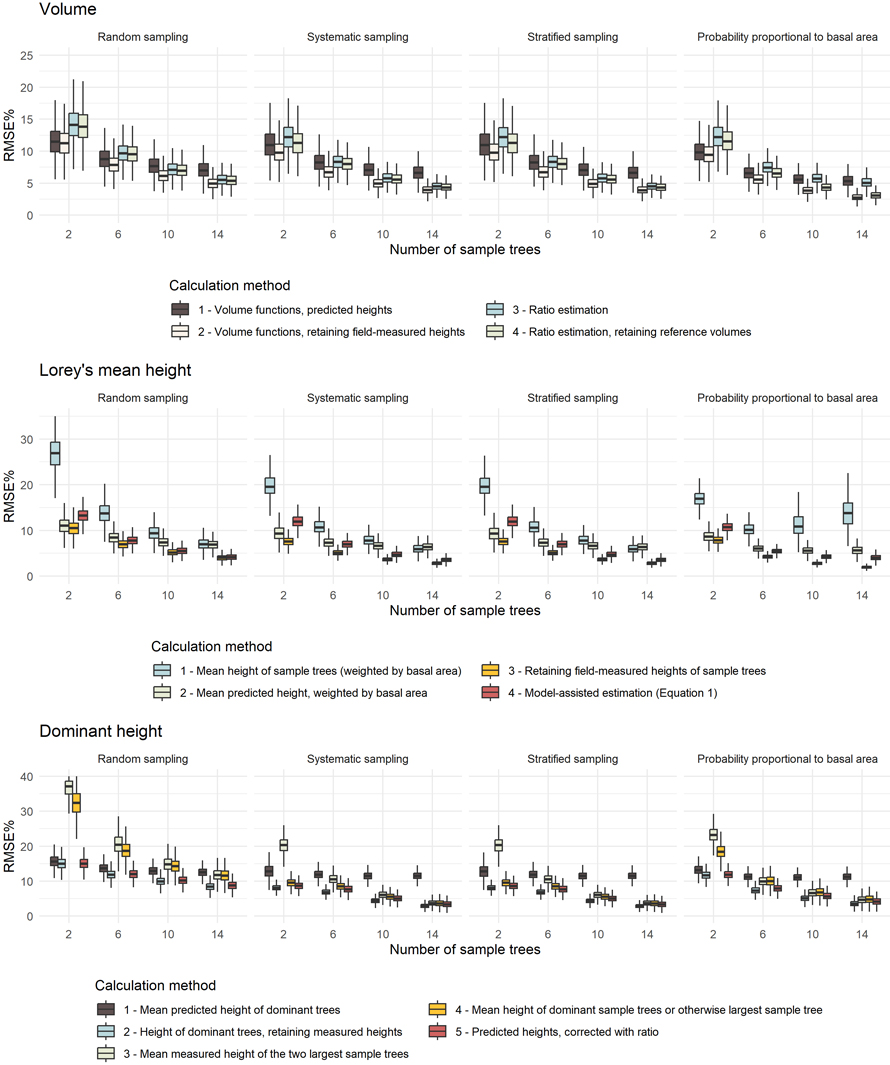
Fig. 3. Root mean square errors relative to the observed mean values (RMSE%) obtained for plot attributes calculated in the Monte Carlo simulation in which we sampled 151 plots in each replication, and compared numbers of sample trees (2, 6, 10, 14), sample tree selection methods, and calculation methods. View larger in new window/tab.
| Table 4. Partial eta-squared values (η2) obtained for main effects and two-way interactions in the analysis of variance (ANOVA) obtained for root mean square error relative to the observed mean values (RMSE%) and mean difference relative to the observed mean values (MD%). | ||
| Factor | RMSE% | MD% |
| η2 | η2 | |
| Sampling* | 0.03 | 0.03 |
| n.samp.tree** | 0.12 | 0.00 |
| method*** | 0.07 | 0.15 |
| sampling:n.samp.tree | 0.03 | 0.01 |
| sampling:method | 0.03 | 0.07 |
| n.samp.tree:method | 0.06 | 0.09 |
| * = sample tree selection method; ** = number of sample trees; *** = calculation method. | ||