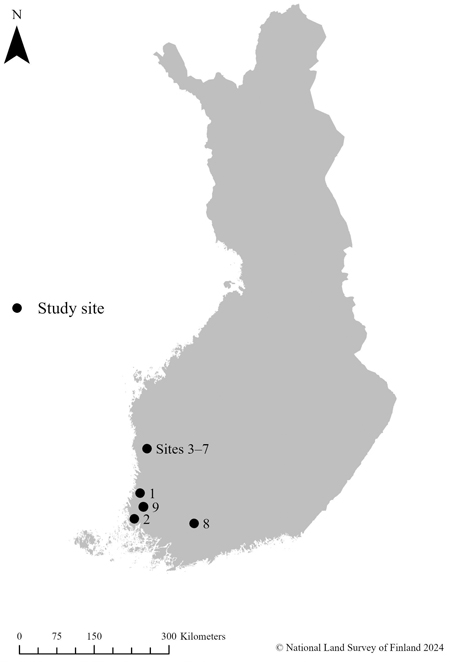
Fig. 1. The nine planting sites of the study located in western Finland, five of them too close to be distinguished on the map. The coordinates of the study area are 60°41’52”N–61°59’38”N and 21°36’24”E–23°48’49”E. The map was created using ArcGIS Pro (version 3.1.0) software.
| Table 1. Information on the planting sites of the study (1–9). The topsoil stoniness class (soil stoniness) of the site was visually determined as being either stoneless, normal, or stony. | ||||||||
| Site | Area (ha) | Soil class1 | Site class2 | Soil stoniness | Slash harvested (yes/no) | Stumps harvested (yes/no) | Seedlings planted (pcs) | Planting density (pcs ha–1) |
| 1 | 3.7 | P | VT | Stoneless | No | No | 6736 | 1821 |
| 2 | 1.6 | M | MT | Stony | No | No | 2626 | 1641 |
| 3 | 5.6 | M | MT | Normal | Yes | No | 10 444 | 1865 |
| 4 | 7.9 | M | MT | Normal | Yes | No | 14 495 | 1835 |
| 5 | 3.5 | M | MT | Normal | Yes | No | 5743 | 1641 |
| 6 | 4.6 | M | MT | Normal | Yes | No | 7882 | 1713 |
| 7 | 7.2 | M | MT | Normal | Yes | No | 12 269 | 1704 |
| 8 | 3.0 | M | OMT | Normal | Yes | Yes | 5406 | 1802 |
| 9 | 3.5 | M | MT | Normal | Yes | No | 6302 | 1801 |
| Total | 40.6 | 71 903 | ||||||
| Average | 4.5 | 1771 | ||||||
| 1 Soil class: P = peatland, M = mineral soil. 2 Site class according to Cajander (1926): VT = Vaccinium vitis-idaea type (sub-xeric heath forests), MT = Vaccinium myrtillus type (mesic heath forests), OMT = Oxalis–Myrtillus type (herb-rich heath forests). | ||||||||
| Table 2. Productivity levels of mounding and MECP (ha G15-h–1, including short [<15 min] delays) and the machine utilization rates used in the cost analysis of the study. The life spans of the base machines and devices are also given, as well as the total annual work time, operating working hours, and silvicultural use. | |||
| Variable | Base machine | ||
| Excavator (17 t) | Forwarder (18 t) | Excavator (17 t) | |
| Device | |||
| Mounding bucket | Mounder | Planting device | |
| Bracke M24.a | Risutec PM-160 | ||
| Productivity (ha G15-h–1) | 0.167ab | 0.900b | 0.119c |
| Machine utilization rate (%) | 85d | 85d | 80 |
| Life span (h) | |||
| Base machine | 12 000d | 12 000d | 12 000d |
| Device | 7500d | 7500d | 7500d |
| Worktime (h yr–1) | |||
| Total | 2220 | 2220 | 2136 |
| Silvicultural | 1332 | 1332 | 1080 |
| Operating hours (G15-h yr–1) | |||
| Total | 1887 | 1887 | 1709 |
| Silvicultural | 1132 | 1132 | 864 |
| Silvicultural use (ha yr–1) | 189 | 1019 | 103 |
| a Saksa et al. (2002). b Saarinen (2006). c The productivity of the MECP was based on the results of this study. d Same value as used in the studies by Strandström et al. (2011) and Hallongren et al. (2014). | |||
| Table 3. Fixed and variable costs and other main parameters of the cost analysis of the study. | |||
| Variable | Base machine | ||
| Excavator (17 t) | Forwarder (18 t) | Excavator (17 t) | |
| Device | |||
| Mounding bucket | Mounder | Planting device | |
| Bracke M24.a | Risutec PM-160 | ||
| Purchase price (€) | |||
| Base machine | 179 000 | 350 000 | 179 000 |
| Device | 5000 | 130 000 | 60 000 |
| Annual depreciation (%) | |||
| Base machine | 15 | 15 | 15 |
| Device | 40 | 40 | 40 |
| Interest rate (%) | 5 | 5 | 5 |
| Storage costs (€ yr–1) | 1058 | 1410 | 1058 |
| Insurance costs (€ yr–1) | 900 | 1800 | 900 |
| Administration costs (€ yr–1) | 8000 | 8000 | 8000 |
| Maintenance supplies (€ yr–1) | 747 | 747 | 1121 |
| Maintenance costs (€ yr–1) | 5520 | 14 400 | 7170 |
| Labor costs | |||
| Hourly wages (€ h–1) | 16.18 | 16.18 | 16.18 |
| Indirect wage cost (%) | 55 | 55 | 55 |
| Kilometer allowance (€ km–1) | 0.57 | 0.57 | 0.67 |
| Fuel and lubrication costs | |||
| Fuel consumption (l h–1) | 9 | 17 | 9 |
| Fuel price (€ l–1) | 1.25 | 1.25 | 1.25 |
| Lubricant consumption (l h–1) | 0.2 | 0.2 | 0.2 |
| Lubrication price (€ l–1) | 3.6 | 3.6 | 3.6 |
| Relocation costs (€ km–1) | 2.35a | 2.35a | 2.35a |
| a Ahtikoski et al. (2024). | |||
| Table 4. Average loading time consumption of the seedling cassette by site (1–9) and average of all loading times in the study. The seedling cassette of the Risutec PM-160 was loaded with 160 seedlings at a time. | ||||||||||
| Site number | Average | |||||||||
| 1 | 2 | 3 | 4 | 5 | 6 | 7 | 8 | 9 | ||
| Loading time (min.s) | 11.34 | 9.29 | 8.30 | 8.39 | 10.17 | 12.38 | 10.15 | 10.54 | 10.57 | 10.08 |
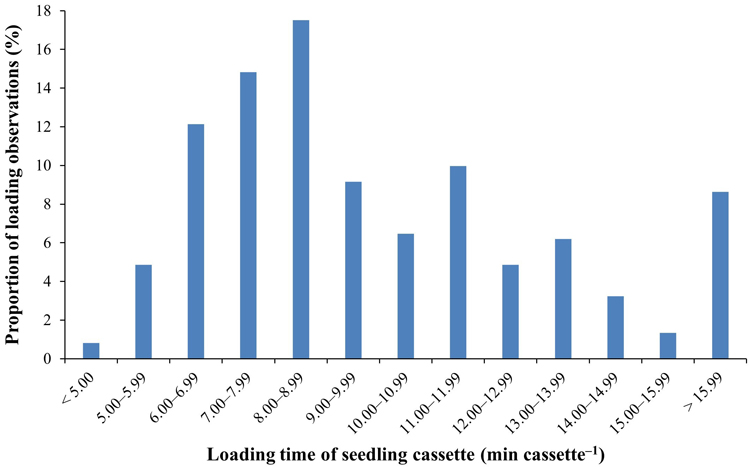
Fig. 2. Distribution of the seedling cassette loading times, with 371 loading time observations included in the final data of this study.
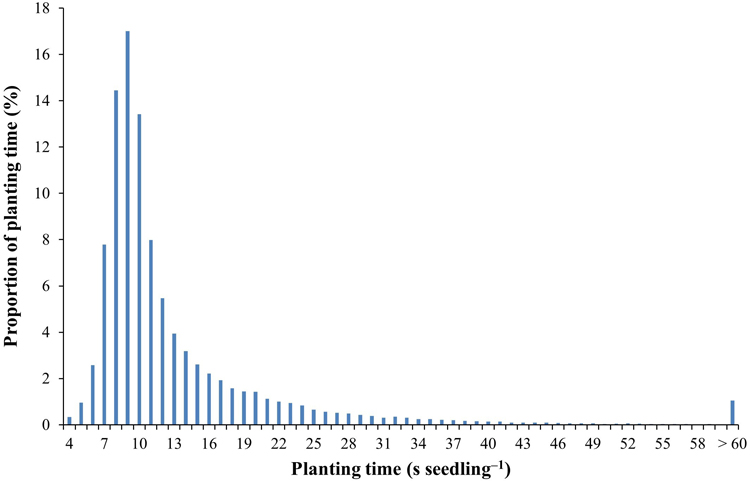
Fig. 3. Distribution of the planting times based on the data from this study.
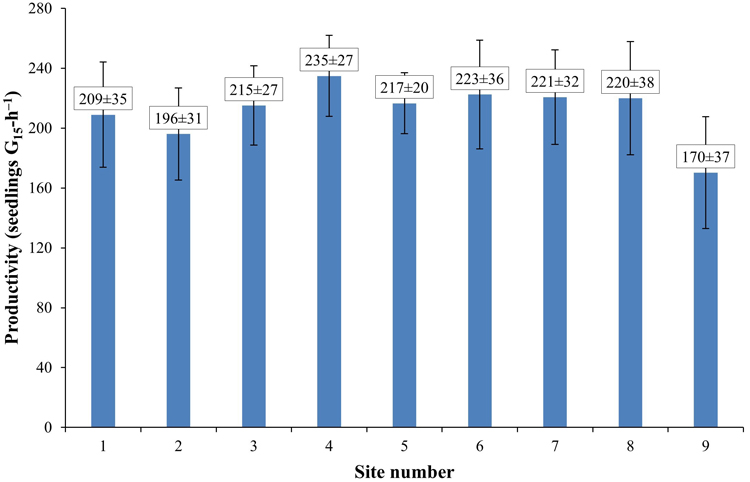
Fig. 4. Operating hour productivity (seedlings G15-h–1, including short [<15 min] delays) and standard deviation of operating hour productivity by planting site (1–9) of the study.
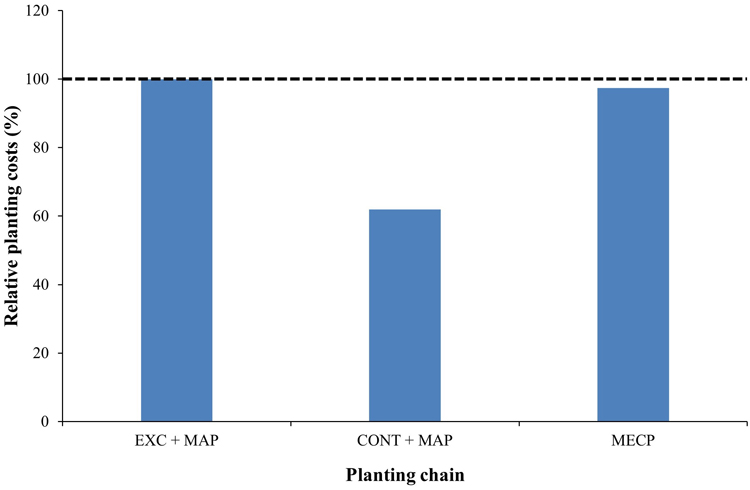
Fig. 5. Relative hectare-based costs of each planting chain (EXC + MAP = excavator-based mounding and manual planting; CONT + MAP = continuously advancing mounding and manual planting; MECP = excavator-based mechanized planting). The operating costs of EXC + MAP are given as 100%, with the costs of the other planting chains being proportional to EXC + MAP.
| Table 5. Effect of the purchase price of the MECP base machine on the relative hectare-based costs (100 = EXC + MAP) when the price changed by ±15%, ±25%, and ±35% in the sensitivity analysis of the study. For each price category of the base machine, the minimum productivity required for MECP to be a competitive option for planting is given. | ||||
| Price change | Purchase price | Relative cost | Requested productivity | |
| (%) | (€) | (ha G15-h−1) | (seedlings G15-h−1) | |
| –35 | 116 350 | 91 | 0.108 | 194 |
| –25 | 134 250 | 93 | 0.110 | 198 |
| –15 | 152 150 | 94 | 0.113 | 203 |
| 0 | 179 000 | 97 | 0.116 | 209 |
| 15 | 205 850 | 100 | 0.119 | 215 |
| 25 | 223 750 | 102 | 0.122 | 220 |
| 35 | 241 650 | 104 | 0.124 | 223 |