| Table 1. Overview of the 15 stands included in the Scots pine (Pinus sylvestris) regeneration experiment at Effaråsen (60°58´N, 14°01´E), showing their stand ID, altitude above sea level (msl), stand age, size (ha) , tree density (trees ha–1), mean canopy area (m2) and its standard deviation (SD), year of last fertilisation (year), and treatment which refers to the tree-retention level (%). Canopy area was calculated from pixels representing tree canopy taller than 2 m within a 20-meter radius around each plot and averaged at the stand level. The stand ID refers to the location in the landscape, with “DS-” referring to Djupsjön, “Eff-” to Effaråsen, “ETO-” to Effartjärnen Ost, “ETV-” to Effartjärnen Väst, “KS-” to Kånåsjön, and “TM-” to Tobacksmyren. The number following the stand ID denotes the percentage of tree retention left after clear-cutting (3–50%). | ||||||||
| Stand ID | Altitude (msl) | Age (years) | Size (ha) | Tree ha–1 | Mean canopy area (m2) | SD | Fertilisation (year) | Treatment |
| DS-3 | 378 | 117 | 14 | 488 | 2.36 | 2.6 | 1992, 2000 | Clear-cut with 3 percent tree retention |
| ETO-3 | 382 | 108 | 4 | 212 | 20.01 | 14.1 | 1992 | |
| TM-3 | 405 | 134 | 7 | 539 | 18.89 | 18.2 | 1982, 1992 | |
| ETV-10 | 378 | 137 | 6 | 283 | 29.01 | 29.3 | 1992 | Clear-cut with 10 percent tree retention |
| KS-10 | 391 | 117 | 7 | 488 | 34.55 | 26.4 | 1992, 2000 | |
| TM-10 | 402 | 134 | 7 | 422 | 69.19 | 46.4 | 1982, 1992 | |
| DS-30 | 376 | 117 | 9 | 490 | 317.15 | 140 | 1992, 2000 | Clear-cut with 30 percent tree retention |
| ETO-30 | 385 | 121 | 4 | 414 | 83.77 | 75.1 | 1992 | |
| ETV-30 | 388 | 137 | 4 | 316 | 68.36 | 72.3 | 1992 | |
| EFF-50 | 391 | 111 | 5 | 411 | 213.48 | 138.0 | 1992 | Clear-cut with 50 percent tree retention |
| ETO-50 | 389 | 121 | 6 | 375 | 223.15 | 79.8 | 1992 | |
| KS-50 | 370 | 117 | 4 | 449 | 307.76 | 200.0 | 1992, 2000 | |
| DS-B50 | 374 | 134 | 5 | 401 | 464.42 | 154 | 1992, 2000 | Burning with 50 percent tree retention |
| ETO-B50 | 389 | 121 | 6 | 470 | 84.98 | 30.2 | 1992 | |
| ETV-B50 | 393 | 137 | 2 | 297 | 378.23 | 49.0 | 1992 | |
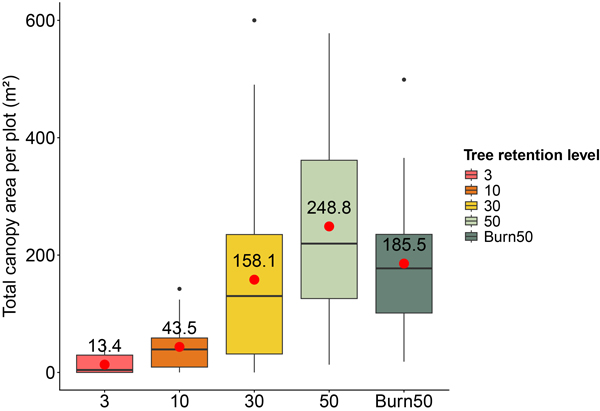
Fig. 1. Distribution of the total tree-canopy area per sample plot (squares meters) for each retention levels (x-axis) across all 15 stands. Red points indicate the mean canopy area calculated from the 12 plots within each stand and the three stands replicated for each retention level. Boxes represent the interquartile range (IQR), with whiskers extending to 1.5 times the IQR. The colours denote different tree-retention levels: pink = 3%, orange = 10%, yellow = 30%, light green = 50%, and dark green = Burn + 50% tree retention (stands where 50% of the trees were retained during harvest and the site was subsequently treated with prescribed burning). Tree-canopy density is lower at reduced tree retention levels because fewer trees are retained around the regeneration plots.
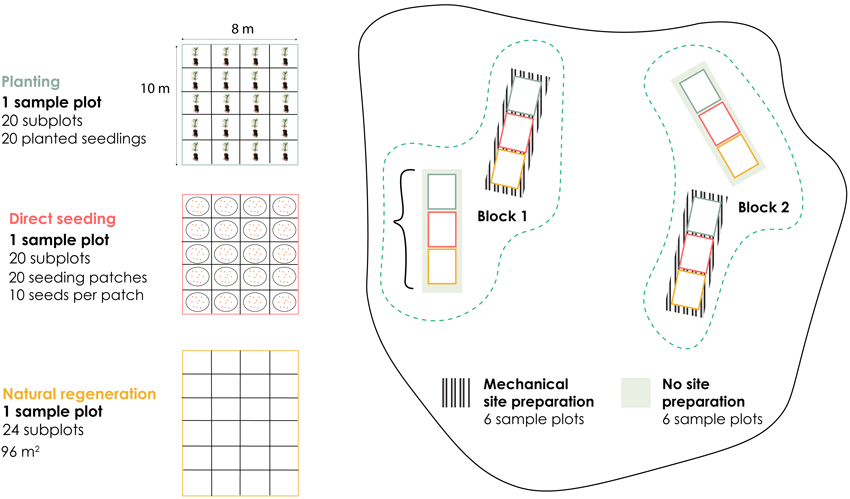
Fig. 2. Regeneration experimental design for Effaråsen. This illustration shows one stand as an example. Each stand contains twelve 8-m × 10-m sample plots. Each stand contained four sample plots of each of the three regeneration method (planted (blue), direct seeding (red), naturally regenerated (orange)). Half of the sample plot for each regeneration method was mechanically site prepared (hatched), while the other half were left untreated (green). The planted and direct-seeded sample plots were divided into four columns and five rows to form 20 subplots, whereas the naturally regenerated sample plots were divided into four columns and six rows to make 24 subplots.
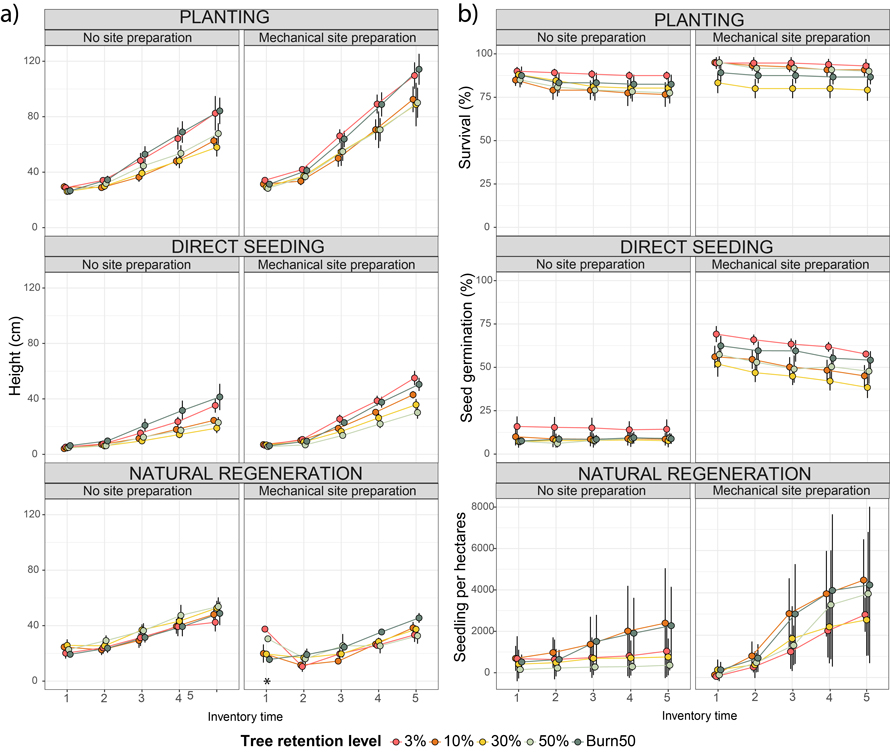
Fig. 3. Mean height (a) and survival, seed germination, and seedling recruitment (b) over time for three regeneration methods (Planted (top), Direct Seeding (middle), and Natural Regeneration (bottom)) across tree retention levels (3%, 10%, 30%, 50%, 50% + Burn) with and without mechanical site preparation (MSP). Curves show mean values across five inventories (1 = October 2017, 2 = June 2019, 3 = May 2020, 4 = August 2020, 5 = September 2021), with error bars representing standard errors (SD; n = 10 per retention level and regeneration method). Planted plots included 20 Pinus sylvestris seedlings per plot, direct seeding 200 seeds per plot, and natural regeneration the total number of Pinus sylvestris seedlings per plot converted to seedlings per hectare.
* Comparisons of MSP treatments for natural regeneration should be interpreted cautiously, as plots without MSP had a three-season head start before site preparation. Note that a few naturally regenerated seedlings in MSP plots at inventory 1 were unusually tall and may have been miscounted.
| Table 2. Predicted mean heights (cm) of Pinus sylvestris seedlings across five inventory periods (Inv. 1–5) for three regeneration methods: Planted, Direct-Seeded, and Naturally Regenerated. Values are shown for both plots treated with mechanical site preparation (M) (MSP = 1) and without mechanical site preparation (MSP = 0). µ = predicted mean height on the response scale, SE = standard error, G = grouping letters from pairwise comparisons (different letters indicate significant differences at α = 0.05). Naturally regenerated predicted means should be interpreted with caution due to the presence of significant interactions. | ||||||||||||||||
| Inventory 1 | Inventory 2 | Inventory 3 | Inventory 4 | Inventory 5 | ||||||||||||
| M | µ | SE | G | µ | SE | G | µ | SE | G | µ | SE | G | µ | SE | G | |
| Planted | 1 | 30.4 | 1.25 | a | 37.4 | 1.70 | a | 55.4 | 3.91 | a | 74.5 | 5.20 | a | 94.6 | 6.47 | a |
| 0 | 27.0 | 1.11 | b | 31.3 | 1.42 | b | 42.6 | 3.01 | b | 54.3 | 3.79 | b | 67.8 | 4.64 | b | |
| Direct Seeded | 1 | 6.34 | 0.26 | a | 8.91 | 0.59 | a | 18.7 | 1.02 | a | 29.7 | 1.55 | a | 41.1 | 2.06 | a |
| 0 | 5.13 | 0.37 | b | 6.97 | 0.67 | b | 12.7 | 1.08 | b | 18.8 | 1.53 | b | 25.4 | 2.11 | b | |
| Naturally Regenerated | 1 | 22.5 | 2.15 | a | 12.2 | 1.13 | b | 18.7 | 1.57 | b | 26.3 | 1.90 | b | 35.6 | 2.19 | b |
| 0 | 22.4 | 1.21 | a | 25.6 | 2.65 | a | 31.2 | 3.32 | a | 39.9 | 3.95 | a | 48.1 | 4.05 | a | |
| Table 3. P-values for the effects of tree retention level, site preparation, and their interaction on mean Pinus sylvestris seedling heights across five inventory periods (October 2017, June 2019, May 2020, August 2020, September 2021). P-values were calculated using linear mixed-effects models with the Satterthwaite approximation for degrees of freedom (lmerTest R package). Bold p-values indicate statistically significant effects (p < 0.05). P-values reported as <0.001 are written as 0.001 for clarity. Models were fitted separately for the three regeneration methods: planted seedlings, direct seeding, and natural regeneration. Arrows indicate the direction of the effect: ↑ = positive effect, ↓ = negative effect of site preparation on mean seedling height (MSP = 1 vs MSP = 0). | ||||||
| Inventory 1 | Inventory 2 | Inventory 3 | Inventory 4 | Inventory 5 | ||
| Planted Seedlings | Tree Retention Level | 0.683 | 0.538 | 0.522 | 0.430 | 0.446 |
| Site Preparation | 0.001 (↑) | 0.001 (↑) | 0.001 (↑) | 0.001 (↑) | 0.001 (↑) | |
| Retention Level × Site | 0.742 | 0.946 | 0.880 | 0.949 | 0.960 | |
| Direct Seeded | Tree Retention Level | 0.904 | 0.688 | 0.082 | 0.100 | 0.044 (↑) |
| Site Preparation | 0.005 (↑) | 0.004 (↑) | 0.001 (↑) | 0.001 (↑) | 0.001 (↑) | |
| Retention Level ×Site | 0.500 | 0.702 | 0.364 | 0.164 | 0.153 | |
| Naturally Regenerated | Tree Retention Level | 0.200 | 0.370 | 0.395 | 0.677 | 0.218 |
| Site Preparation | 0.036 (↓) | 0.001 (↓) | 0.001 (↓) | 0.001 (↓) | 0.001 (↓) | |
| Retention Level × Site | 0.040 | 0.683 | 0.313 | 0.084 | 0.147 | |
| Table 4. Predicted proportion of survival (planted), proportion of germination (direct seeded), or recruitment of Pinus sylvestris seedlings across five inventory periods (Inv. 1–5) for three regeneration methods: Planted, Direct-Seeded, and Natural Regeneration. Values are shown for mechanical site preparation (M) (MSP = 1) and without mechanical site preparation (MSP = 0) plots. µ = predicted mean height on the response scale, SE = standard error, G = grouping letters from pairwise comparisons (different letters indicate significant differences at α = 0.05). Naturally regenerated predicted means should be interpreted with caution due to the presence of significant interactions. | ||||||||||||||||
| Inventory 1 | Inventory 2 | Inventory 3 | Inventory 4 | Inventory 5 | ||||||||||||
| M | µ | SE | G | µ | SE | G | µ | SE | G | µ | SE | G | µ | SE | G | |
| Planted | 1 | 91.2 | 2.31 | a | 89.0 | 2.79 | a | 88.8 | 3.10 | a | 88.0 | 3.23 | a | 87.3 | 3.34 | a |
| 0 | 86.5 | 2.19 | a | 82.5 | 2.59 | b | 80.9 | 2.82 | b | 79.9 | 2.93 | b | 79.5 | 3.05 | b | |
| Direct Seeded | 1 | 57.95 | 7.75 | a | 54.87 | 7.15 | a | 52.04 | 6.57 | a | 50.43 | 6.28 | a | 47.34 | 5.83 | a |
| 0 | 6.35 | 0.97 | b | 5.88 | 0.88 | b | 6.32 | 0.91 | b | 6.63 | 0.93 | b | 6.69 | 0.93 | b | |
| Naturally Regenerated | 1 | 1.02 | 0.28 | b | 5.39 | 0.82 | a | 14.46 | 2.32 | a | 22.15 | 3.24 | a | 26.79 | 3.55 | a |
| 0 | 2.52 | 0.55 | a | 3.69 | 0.58 | b | 5.38 | 0.91 | b | 6.28 | 0.99 | b | 7.77 | 1.11 | b | |
| Table 5. P-values from mixed-effects models testing the effects of tree retention level, site preparation, and their interaction on survival, germination, and recruitment of Pinus sylvestris seedlings across five inventory periods (October 2017, June 2019, May 2020, August 2020, September 2021). P-values were calculated using Type II Wald F-tests with the Kenward–Roger approximation for survival and germination, and Wald χ² tests for recruitment. Bold p-values indicate statistically significant effects (p < 0.05). P-values reported as <0.001 are written as 0.001 for clarity. Columns represent inventory periods, and rows represent the main effects and their interaction (tree retention level × site preparation) on survival (proportion of 20 planted seedlings), germination (proportion of 200 seeds), and recruitment (number of seedlings per plot). Arrows indicate the direction of the effect: ↑ = positive effect, ↓ = negative effect of site preparation on the proportion of survival/germination or seedling recruitment (MSP = 1 vs MSP = 0). | ||||||
| Inventory 1 | Inventory 2 | Inventory 3 | Inventory 4 | Inventory 5 | ||
| Planted seedlings % survival | Tree Retention Level | 0.808 | 0.751 | 0.721 | 0.779 | 0.798 |
| Site Preparation | 0.079 | 0.018 (↑) | 0.006 (↑) | 0.008 (↑) | 0.011 (↑) | |
| Retention Level × Site | 0.359 | 0.222 | 0.494 | 0.512 | 0.416 | |
| Direct seeded % Germination | Tree Retention Level | 0.493 | 0.373 | 0.387 | 0.437 | 0.455 |
| Site Preparation | 0.001 (↑) | 0.001 (↑) | 0.001 (↑) | 0.001 (↑) | 0.001 (↑) | |
| Retention Level × Site | 0.716 | 0.749 | 0.858 | 0.944 | 0.938 | |
| Natural regeneration Recruitment | Tree Retention Level | 0.267 | 0.099 | 0.077 | 0.006 | 0.002 |
| Site Preparation | 0.001 (↓) | 0.693 | 0.001 (↑) | 0.001 (↑) | 0.001 (↑) | |
| Retention Level × Site | 0.004 | 0.029 | 0.008 | 0.001 | 0.001 | |
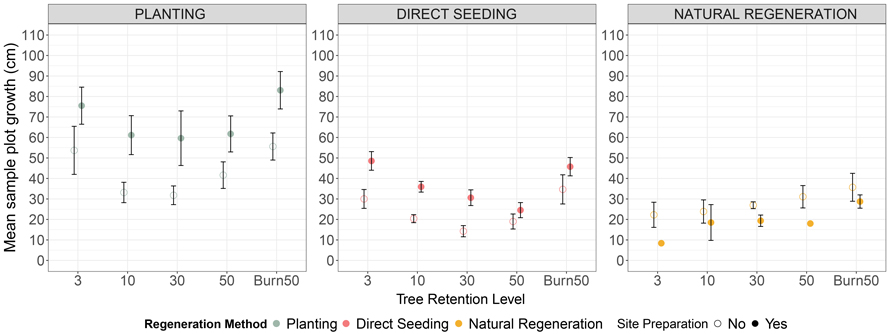
Fig. 4. Mean height difference from inventory 5 to inventory 1 (± standard error) of Pinus sylvestris seedlings under different regeneration methods (Natural regeneration, Planting, and Direct seeding) across tree retention levels (3%, 10%, 30%, 50%, and Burn50) and site preparation conditions (No site preparation vs. Site preparation).
* The natural regeneration treatment with no site preparation needs to be interpreted with care as the seedlings started to regenerate 3 years prior the site preparation was carried out.
| Table 6. P-values from mixed-effects models testing the effects of total tree canopy area, tree retention level, and site preparation on mean sample plot seedling height (Height), sample plot survival (out of the 20 original seedlings)/germination proportion (out of the 200 original seeds)/Recruitment (number of seedlings per sample plot) (Surv), and mean sample plot growth (growth). Significant effects are highlighted in bold, with p-values less than 0.05 indicating statistically significant relationships. P-values reported as <0.001 are written as 0.001 for clarity. | ||||
| Height | Surv | Growth | ||
| Planted Seedlings | Canopy area | 0.001 | 0.006 | 0.010 |
| Site Preparation | 0.001 | 0.028 | 0.001 | |
| Direct Seeded | Canopy area | 0.001 | 0.673 | 0.001 |
| Site Preparation | 0.001 | 0.001 | 0.001 | |
| Naturally Regenerated | Canopy area | 0.714 | 0.244 | 0.293 |
| Site Preparation | 0.001 | 0.001 | 0.001 | |
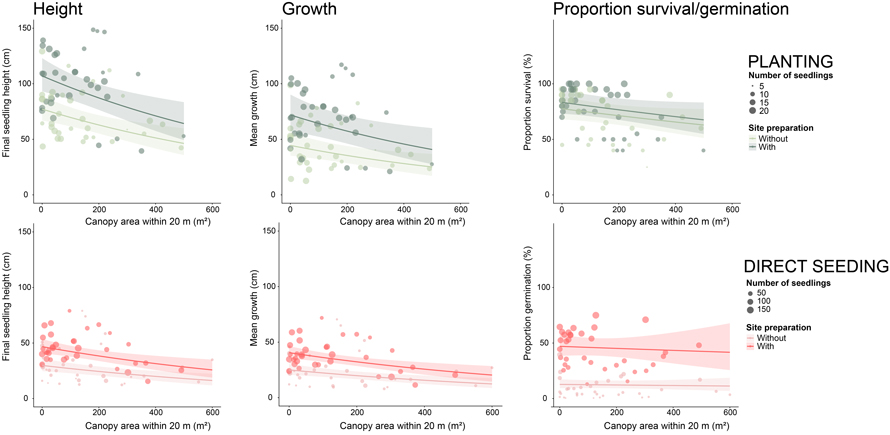
* The natural regeneration treatment with no site preparation needs to be interpreted with care as the seedlings started to regenerate 3 years prior the site preparation was carried out. View larger in new window/tab.
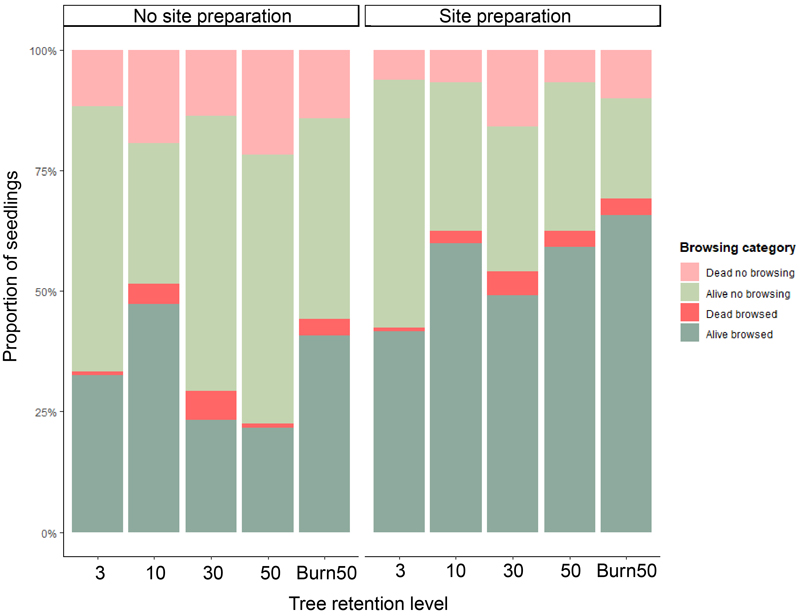
Fig. 6. Proportion of Pinus sylvestris seedlings for each browsing level from the 1192 seedlings originally planted and their browsing status after 5 growing seasons. The dark red and dark green bars represent the browsed seedlings, whereas the light red and light green represent the non-browsed seedlings. Red bars are dead seedlings, whereas green bars are live seedlings after 5 years. Alive seedlings are heavily browsed but still alive. Categories are as follows: (1) Plants that died from causes other than browsing; (2) Plants that survived without any browsing injuries; (3) Plants that were browsed but died, either due to browsing or other causes; (4) Plants that were browsed but survived.