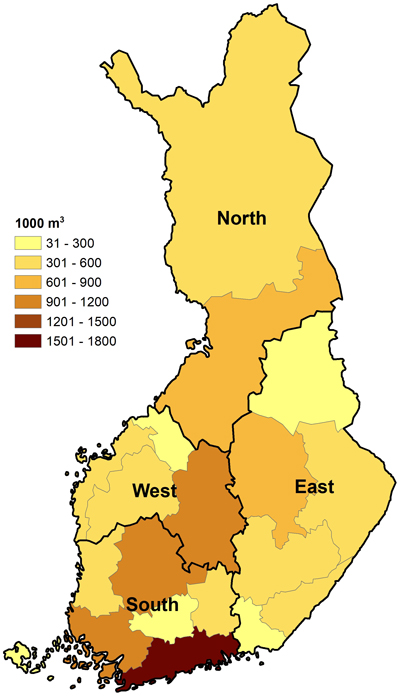
Fig. 1. Forest chip consumption (solid cubic metres) in 2023 by region and by the four major area classifications used in this study, in Finnish heat-only and combined heat and power (CHP) plants (Official Statistics of Finland 2024a).
| Table 1. Finnish energy wood suppliers and their total, average, and median supply volumes in 2023 by type of company in the analysed survey data of energy wood deliveries. | ||||
| Type of supplier | Number of suppliers | Annual supply volume, 1000 m3 | Average supply volume by supplier, 1000 m3 | Median supply volume by supplier, 1000 m3 |
| Energy wood harvesters and traders | 36 | 1984 | 55 | 39 |
| Energy companies and heat entrepreneurs | 14 | 1824 | 130 | 12 |
| Forest industry companies | 15 | 2251 | 150 | 22 |
| Total | 65 | 6058 | 93 | 30 |
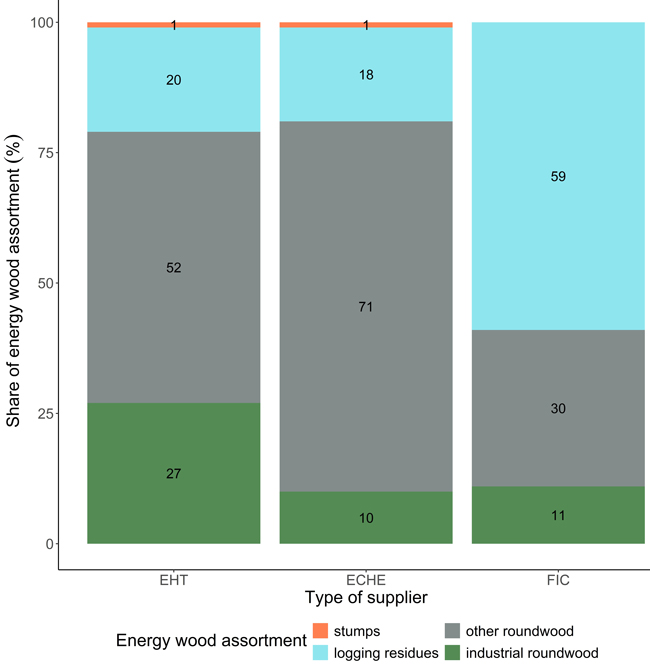
Fig. 2. The proportion of energy wood assortments varied by supplier type in the data of survey for energy wood deliveries in Finland in 2023. The total delivery volume of energy wood harvesters and traders (EHT) was 1.984 million m3, energy companies and heat entrepreneurs (ECHE) presented a total of 1.824 million m3 and forest industry companies (FIC) totalled 2.251 million m3. In total, the data included information from 65 Finnish energy wood suppliers. The EHT supplier group included 36 operators, ECHE 14 operators and FIC 15 operators.
| Table 2. A total of three Finnish energy wood suppliers who responded to the survey indicated that they have supplied imported energy wood and forest chips and provided the corresponding volumes. The supply volumes reported by these three suppliers are presented by energy wood assortment, expressed in solid cubic metres. | ||||||
| Respondents, pcs | Supply by energy wood assortment | |||||
| Total | Industrial roundwood | Other roundwood | Logging residues | Stumps | ||
| Total supply volume, 1000 m3 | 3 | 1909 | 121 | 885 | 897 | 6 |
| Imported wood supply, 1000 m3 | 3 | 94 | - | 79 | 15 | - |
| Share of imported wood, % | 3 | 5 | - | 9 | 2 | - |
| Table 3. A total of 16 Finnish energy wood suppliers who responded to the survey indicated that they have sourced wood from land-use change areas and provided the corresponding volumes. The supply volumes reported by these 16 suppliers are presented by energy wood assortment, expressed in solid cubic metres. | ||||||
| Respondents, pcs | Supply amount by energy wood assortment | |||||
| Total | Industrial roundwood | Other roundwood | Logging residues | Stumps | ||
| Total supply volume, 1000 m3 | 16 | 1816 | 210 | 901 | 690 | 15 |
| Supply of wood sourced from land-use change areas, 1000 m3 | 16 | 148 | 30 | 75 | 36 | 8 |
| Share of wood sourced from land-use change areas, % | 16 | 8 | 14 | 8 | 5 | 52 |
| Table 4. The number of delivery points, and the total number of deliveries in the dataset used for the transport distance analysis in this study, and total consumption. The data are based on a 2023 survey of energy wood deliveries in Finland. The table also shows the consumption of forest chips in 2023, according to the Wood in Energy Generation statistics (Official Statistics of Finland 2024a). The volumes are expressed in solid cubic metres. | |||
| Region | Number of delivery points, pcs. | Total delivery volume in data, 1000 m3 | Recorded forest chip consumption in 2023, 1000 m3 |
| South | 57 | 1537 | 5142 |
| East | 57 | 1577 | 2434 |
| West | 23 | 380 | 2152 |
| North | 16 | 722 | 1301 |
| Total | 153 | 4216 | 11 028 |
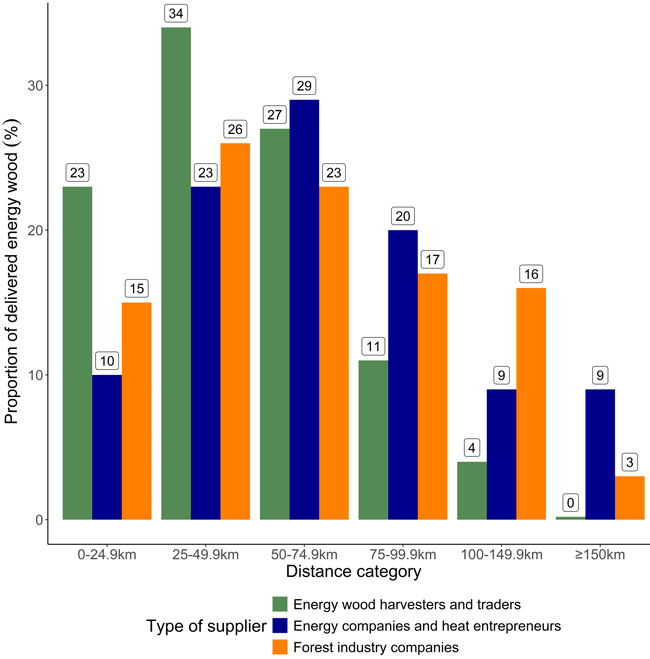
Fig. 3. The proportion of the six transport distance categories in relation to the amount of energy wood delivered, split into three categories by supplier type, based on the analysed survey data of energy wood deliveries in Finland in 2023.
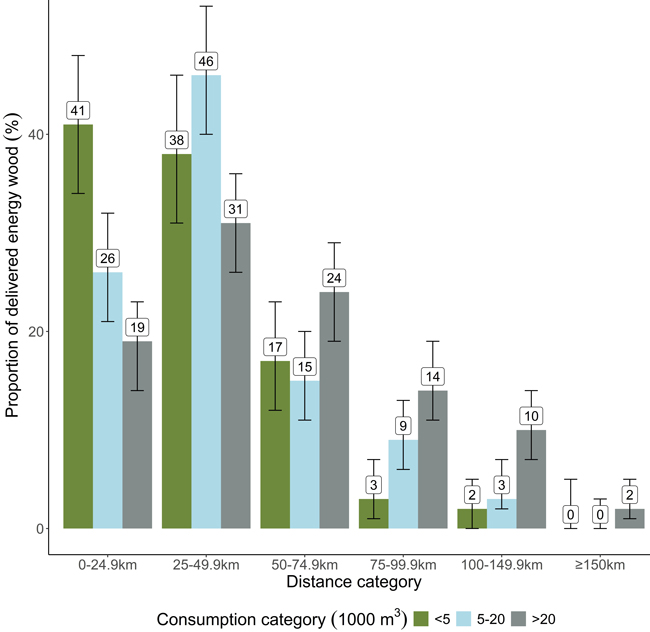
Fig. 4. Estimated proportions for each distance and consumption category based on the developed energy wood transport model of Finland. The model is based on survey data of energy wood deliveries in Finland in 2023. The figure presents the 95% confidence interval for each estimate. Full parameter estimates for fixed effects (logit scale) are provided in Supplementary file S2.
| Table 5. p-values of the Tukey-Kramer multiple comparison test, which examined the statistical significance of the combined effect of forest chip consumption and transport distance category on the proportion of energy wood delivered for each transport distance category. Statistically significant p-values (p ≤ 0.05) are bolded. | |||
| Distance category | p-values for comparisons of consumption categories of forest chips | ||
| <5 vs. 5–20 | <5 vs. >20 | 5–20 vs. >20 | |
| 0–24.9 km | 0.006 | <0.001 | 0.098 |
| 25–49.9 km | 0.241 | 0.227 | 0.001 |
| 50–74.9 km | 0.903 | 0.138 | 0.030 |
| 75–99.9 km | 0.040 | 0.001 | 0.144 |
| 100–149.9 km | 0.484 | 0.006 | 0.015 |
| ≥150 km | 0.977 | 0.348 | 0.263 |
| Table 6. A total of 36 Finnish energy wood suppliers who responded to the survey indicated that they have their own terminal capacity and provided corresponding figures. A terminal was defined as permanent storage areas of at least 0.5 hectares, where suppliers can store energy wood or wood fuels during the supply chain. The terminal capacity reported by these 37 suppliers is presented in hectares, broken down by distance category. The distance refers to the location of the terminal capacity in relation to the location of the plants to which these suppliers deliver energy wood. | ||
| Distance category | Area, ha | Share of total capacity, % |
| 0 km | 44 | 14 |
| 0.1–24.9 km | 143 | 46 |
| 25–74.9 km | 86 | 27 |
| 75–99.9 km | 32 | 10 |
| 100–149.9 km | 7 | 2 |
| Total | 312 | 100 |