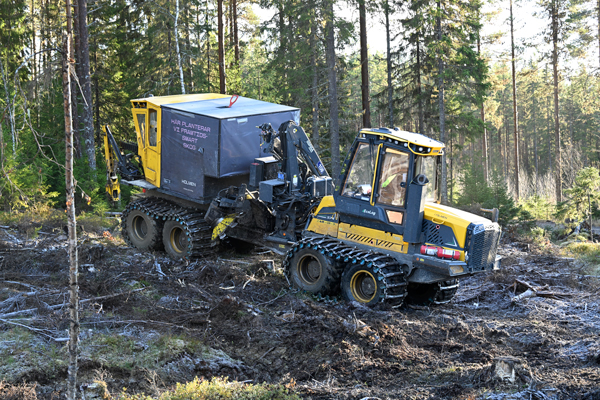
Fig. 1. PlantMax planting machine built on Eco Log 574E forwarder, equipped with a MidiFlex disc trencher. Photo Mikael Rönnqvist.
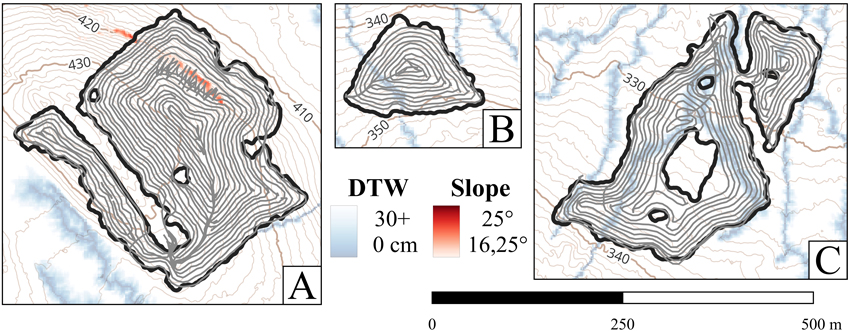
Fig. 2. The PlantMax GNSS tracks shown in gray across test sites A–C, with the Depth-to-Water map in blue and the slope magnitude map in red. The black lines represent the site borders, and the brown contours indicate elevation in meters.
| Table 1. Data of the test site’s location (in WGS 84 coordinate system), area, and characteristic challenges for the machine. The area is the net area for regeneration acquired with the PlantP module, without removing wet or steep areas. | |||
| Test site | Coordinates | Area | Characteristic |
| A | 63°54’13”N, 17°17’51”E | 6.6 ha | Slope in the north area |
| B | 63°51’49”N, 17°12’42”E | 1.5 ha | Wet area that splits the site |
| C | 63°51’38”N, 17°19’17”E | 5.0 ha | Widespread network of wet areas throughout the site |

Fig. 3. Overview of the PlantP-module input (a-d) and output (e-f) used to define the net area for regeneration. a) Overview map of the test site with boarders of the planned area to harvest including No-go areas defined by Holmen Skog (red areas). b) Harvester positions when feeling a tree from harvested production (hpr) files are used to define the net regeneration area. (c) Depth-to-Water (DTW) map where a 0.3 m threshold is used to exclude areas predicted to be too wet for mechanical site preparation. (d) Parent material maps from the Swedish Geological Survey are used to exclude peat soils. (e) Net area for regeneration including wet areas f) Net area for regeneration excluding wet areas. Manually suggested passages in wet areas are marked with yellow lines. © Lantmäteriet, © The Swedish Environmental Protection Agency, © Swedish Geological Survey.
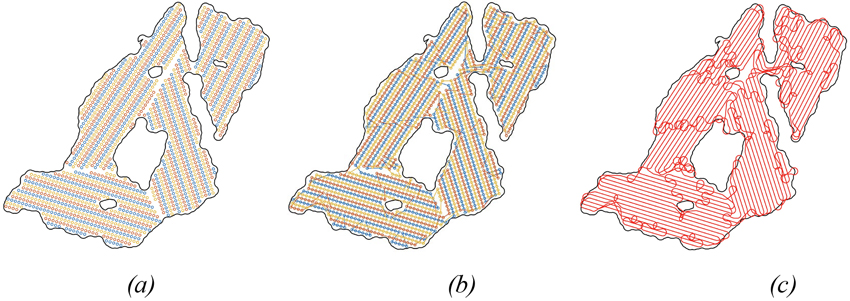
Fig. 4. (a) TerraTrail’s node grid of site C, with every third node column sharing a split index, displayed by the color of the node. (b) The Euclidean path segments created by the three different TSP calculations, defined by the split index. (c) The line segments united into one, and a Dubins path has been applied, which considers the turning radius of the vehicle.
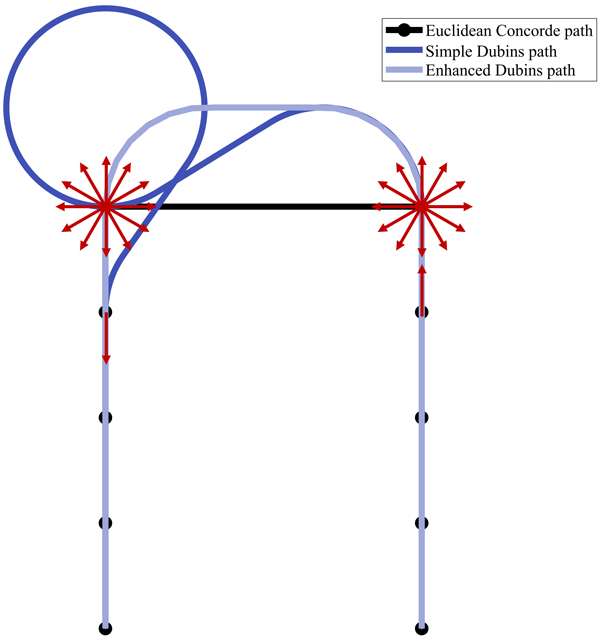
Fig. 5. The two distinct Dubins paths generated from the Euclidean Concorde TSP sequence for TerraTrail. The simpler Dubins path, which was calculated first, requires a detour at the upper-left corner to tangent the upper-left node with a straight leftward Dubins heading, as defined by Eq. 1. By calculating the Enhanced Dubins path, altering the Dubins heading of the two upper nodes marked with red arrows, resulted in a 30% shorter path, compared to the simple Dubins path. This resulted in changing the Dubins heading direction of the upper-left node to a downward orientation.
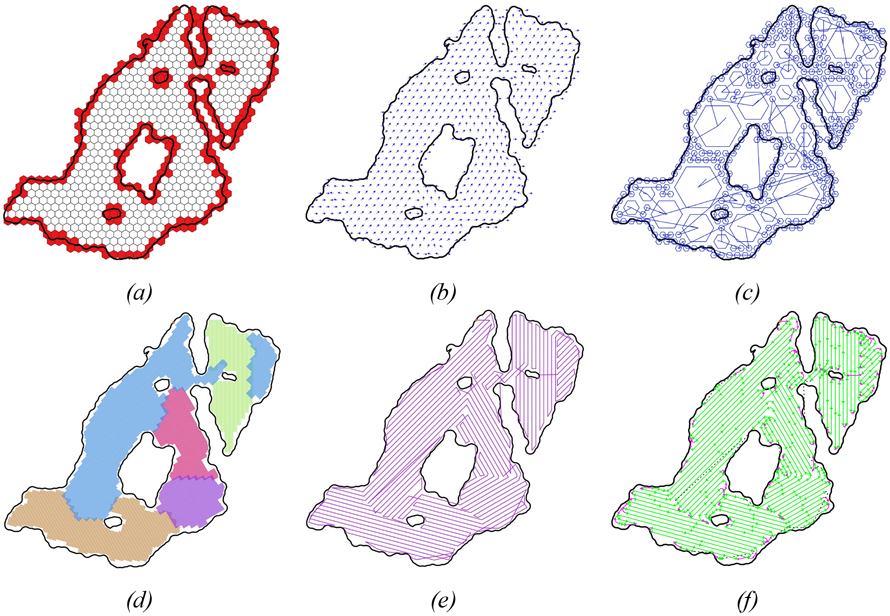
Fig. 6. Results from applying the Pathfinder solution approach to site C. (a) distribution of hexagons in the area, with red hexagons representing no-go zones, (b) initial dominating slope aspects indicated by arrows, (c) solution of mixed sized hexagons with similar slope aspects in the first phase, (d) identified regions with similar aspects in different colors, (e) TSP-solution (f) full route solution with turning and driving direction indicated. Pink indicates turns smaller than the turning radius where reversing is needed.
| Table 2. Comparison of which key performance indicators used in five different studies of coverage path planning in terrain. | ||||||||||
| Coverage rate | Overlapping rate | Skipped area | Path length | Climb energy | Calculation time | Turns | Erosion | Time cost | Side slope | |
| Jin and Tang 2011 | x | x | x | |||||||
| Wu et al. 2019 | x | x | x | x | x | |||||
| Qiu et al. 2024 | x | x | x | x | ||||||
| Hansson et al. 2025 | x | x | x | |||||||
| Arvidsson et al. 2025 | x | x | x | |||||||
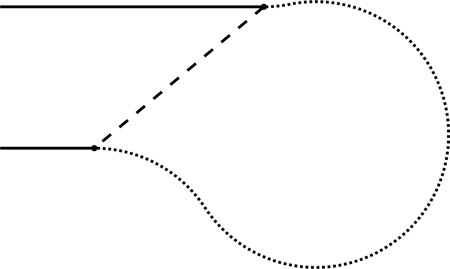
Fig. 7. The coarse dashed Euclidean connections is exchanged with Dubins paths marked with a fine dotted line, calculated with a heading which is tangent to the driving lines marked with the solid lines.
| Table 3. Distance and coverage of the different coverage path planners and real world PlantMax data. | |||||||||
| Test site | PlantMax | TerraTrail | Pathfinder | ||||||
| Dubins distance [m] | Euclidean distance [m] | Euclidean coverage [%] | Dubins distance [m] | Euclidean distance [m] | Dubins coverage [%] | Dubins distance [m] | Euclidean distance [m] | Dubins coverage [%] | |
| A | - | 14 945 | 85.9 | 15 930 | 14 180 | 95.5 | 14 518 | 13 413 | 96.6 |
| B | - | 2698 | 78.7 | 3837 | 3275 | 96.4 | 3554 | 2957 | 95.6 |
| C | - | 9762 | 79.8 | 12 691 | 10 839 | 94.2 | 12 844 | 10 410 | 95.7 |
| Table 4. Comparison metric derived by normalizing the results from Table 3, calculated by dividing the path length by the corresponding coverage. This metric allows for evaluating the efficiency of each path planner. Note that the coverage values for each column are based on their respective path types, meaning Euclidean and Dubins coverages differ. | ||||||
| Test site | PlantMax | TerraTrail | Pathfinder | |||
| Dubins length per coverage [m / %] | Euclidean length per coverage [m / %] | Dubins length per coverage [m / %] | Euclidean length per coverage [m / %] | Dubins length per coverage [m / %] | Euclidean length per coverage [m / %] | |
| A | - | 17 406 | 16 673 | 15 422 | 14 966 | 14 118 |
| B | - | 3428 | 3978 | 3520 | 3719 | 3166 |
| C | - | 12 232 | 13 474 | 12 120 | 13 425 | 11 143 |
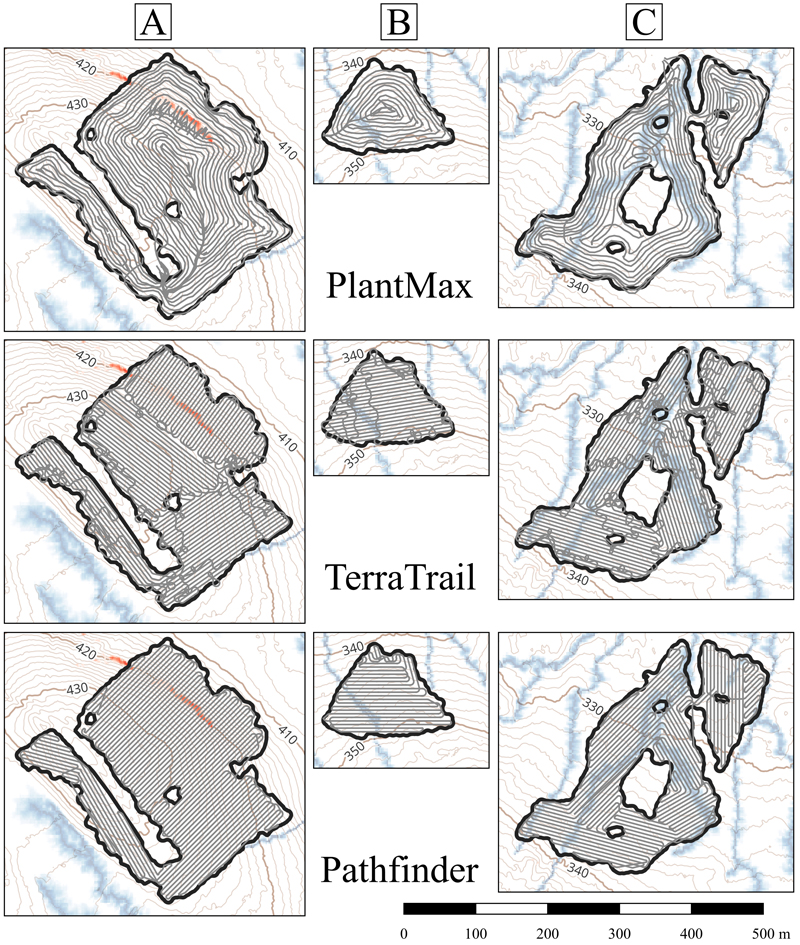
Fig. 8. GNSS track of PlantMax, along with the two automated path planners, TerraTrail and Pathfinder, on the three test sites of this study. This test scenario is unconstrained and aims to cover the entire site with the shortest path possible.
| Table 5. Distance and coverage of the different automated coverage path planners where wet areas are excluded. | |||||||||
| Test site | Plantmax | TerraTrail | Pathfinder | ||||||
| Dubins distance [m] | Euclidean distance [m] | Dubins coverage [%] | Dubins distance [m] | Euclidean distance [m] | Dubins coverage [%] | Dubins distance [m] | Euclidean distance [m] | Dubins coverage [%] | |
| A | - | 14 945 | 85.9 | 16 435 | 14 482 | 95.5 | 14 455 | 13 396 | 96.6 |
| B | - | 2698 | 78.5 | 3431 | 2987 | 93.8 | 3073 | 2637 | 96.8 |
| C | - | 9762 | 78.8 | 10 072 | 8455 | 89.1 | 8637 | 7175 | 86.1 |
| Table 6. Comparison metric derived by normalizing the results from Table 5, calculated by dividing the path length by the corresponding coverage. This metric allows for evaluating the efficiency of each path planner. Note that the coverage values for each column are based on their respective path types, meaning Euclidean and Dubins coverages differ. | ||||||
| Test site | PlantMax | TerraTrail | Pathfinder | |||
| Dubins length per coverage [m / %] | Euclidean length per coverage [m / %] | Dubins length per coverage [m / %] | Euclidean length per coverage [m / %] | Dubins length per coverage [m / %] | Euclidean length per coverage [m / %] | |
| A | - | 17 406 | 17 209 | 15 755 | 14 966 | 14 098 |
| B | - | 3435 | 3656 | 3324 | 3175 | 2774 |
| C | - | 12 380 | 11 308 | 10 083 | 10 028 | 8674 |
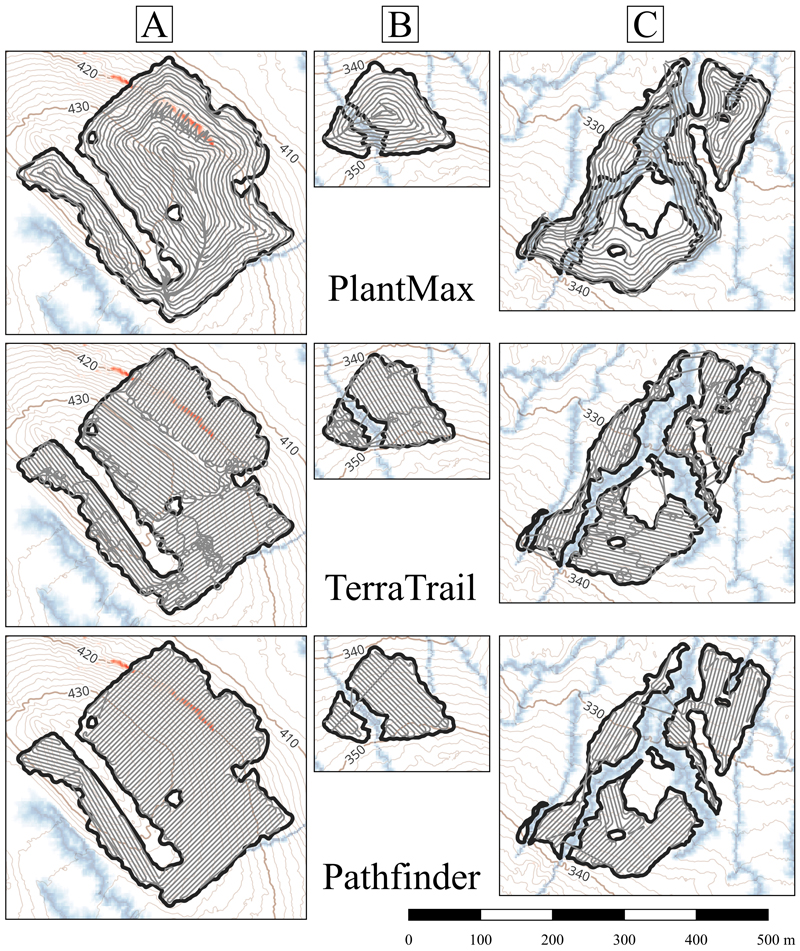
Fig. 9. GNSS track of PlantMax, along with the two automated path planners, TerraTrail and Pathfinder, on the three test sites of this study. This test scenario is constrained to the Depth-to-Water (DTW) map and aims to cover the entire site with the shortest path possible, while avoiding wet (blue) areas. Note that the Pathfinder route is only using the forcing passages in Fig. 3f, even though it looks like the passages are in various places. These lines are normally dotted to make the operator aware that it is not the exact path visualized.
| Table 7. Comparison of Dubins path length per coverage between TerraTrail and Pathfinder in both unconstrained and constrained scenarios when divided by the PlantMax Euclidean metrics. The table values represent the averages across the three test sites, with each site given equal weight to ensure that the area of the test sites did not influence the results. Dubins refers to the ratio of Dubins path length per Dubins coverage, of the automated coverage path planners, and normalized by the Euclidean path length per Euclidean coverage ratio of PlantMax. Euclidean denotes the ratio of Euclidean path length per Euclidean coverage, divided by the same of PlantMax. A positive percentage for both path types indicates that the automated CPPs generates longer paths than PlantMax, and vice versa. Coverage represents the ratio of Dubins coverage of the automated CPPs divided by the Euclidean coverage of PlantMax, where the constrained scenario excluded the wet area. A positive percentage for coverage means that the automated CPPs has higher coverage than PlantMax. | ||||||
| Unconstrained | Constrained | |||||
| Dubins | Euclidean | Coverage | Dubins | Euclidean | Coverage | |
| TerraTrail | 6.8% | –3.7% | 17.8% | –1.1% | –10.4% | 14.6% |
| Pathfinder | 0.9% | –12.2% | 18.6% | –13.5% | –25.9% | 15.0% |