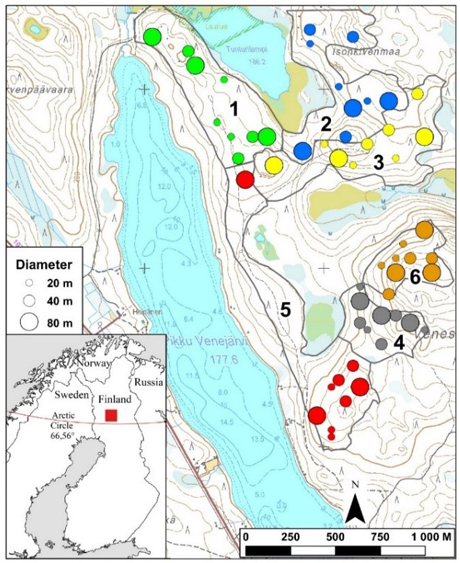
Fig. 1. Location of the study site in Veneselkä hill in Rovaniemi, with gap cuttings randomized into six blocks (indicated by different colors). Figure modified from Hallikainen et al. (2019).
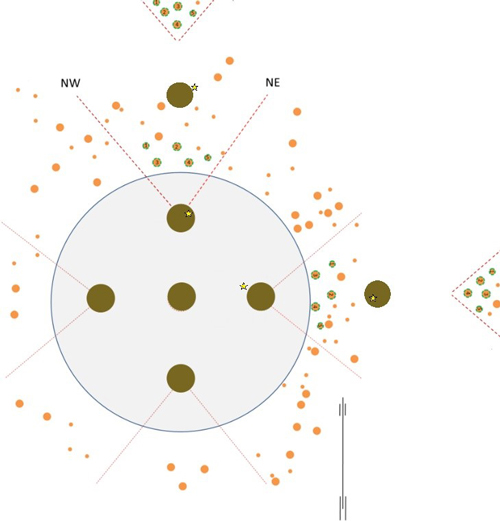
Fig. 2. Example of the sampling design with a gap (d = 20 m). Five circular regeneration plots in brown are shown within the gap, and two additional plots outside the gap on the northern and eastern sides represent the four control plots positioned in all four cardinal directions. The orange dots represent trees, and the dots with a green outline represent the dominant trees from which pendulous lichen abundance were assessed. The dots further away on the northern and eastern sides represent the sample trees within the forest in all four cardinal directions (~15 m from the outer border of the control plots). Figure modified from Hallikainen et al. 2019.
| Table 1. Descriptive statistics of the covariates and the responses tested in the models 1–3. In addition to these, the categorical variables gap diameter and direction of a circular sample plot were tested in the models. Pendulous lichen category comes from the pendulous lichen assessed from five nearest dominant trees in each cardinal direction within each gap (following the methods described by Kumpula et al. (2006). Abbreviations used: Qu. = quartile, d1.3 = diameter at breast height (1.3 m). | ||||||
| Min. | 1.Qu. | Median | Mean | 3.Qu. | Max. | |
| At sample plot level | ||||||
| Number of seedlings with pendulous lichens on circular sample plot (response) | 0.00 | 0.00 | 0.00 | 0.86 | 1.00 | 11.00 |
| Number of all seedlings on plot (only plots recruited by seedlings) | 1.00 | 9.00 | 17.00 | 21.40 | 29.75 | 102.00 |
| Number of Scots pine seedlings on plot (only plots recruited by seedlings) | 0.00 | 8.00 | 14.50 | 17.21 | 24.00 | 65.00 |
| Height of Scots pine seedlings on plot, cm | 2.00 | 12.00 | 20.00 | 26.80 | 36.00 | 139.00 |
| Age of Scots pine seedlings on plot, years | 2.00 | 5.00 | 6.00 | 6.05 | 7.00 | 14.00 |
| Height of all seedlings on plot, cm | 2.00 | 11.00 | 17.83 | 22.70 | 30.00 | 91.00 |
| Height of longest Scots pine seedling, cm | 7.00 | 78.00 | 108.00 | 121.60 | 150.00 | 440.00 |
| Age of longest Scots pine seedling, years | 4.00 | 10.00 | 15.00 | 19.86 | 26.00 | 79.00 |
| At gap level, gap edge parameters | ||||||
| Basal area, m2 ha–1 | 0.57 | 13.79 | 17.68 | 18.13 | 22.46 | 35.83 |
| Number of tree stems ha–1 | 50.00 | 400.00 | 625.00 | 644.10 | 850.00 | 1450.00 |
| Total volume of tree trunks, m3 ha–1 | 3.31 | 112.04 | 144.51 | 149.15 | 185.54 | 327.68 |
| Mean diameter (d1.3) of trees, cm | 8.89 | 14.11 | 17.17 | 17.90 | 20.19 | 31.73 |
| Mean height of trees, m | 9.38 | 12.38 | 13.45 | 13.84 | 15.08 | 19.60 |
| Mean of pendulous lichen category (categories 0–3, 10 trees classified) | 0.70 | 1.10 | 1.30 | 1.29 | 1.40 | 2.00 |
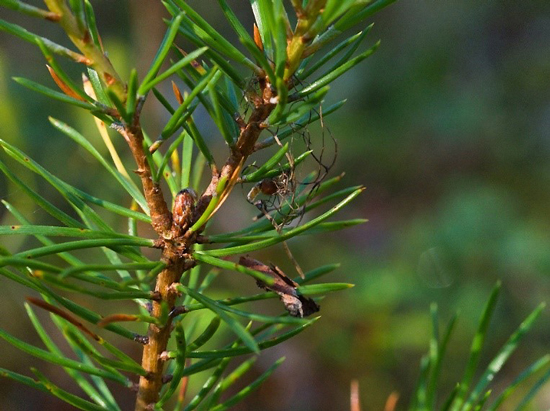
Fig. 3. Example of a Scots pine seedling with pendulous lichen (and some bark) attached.
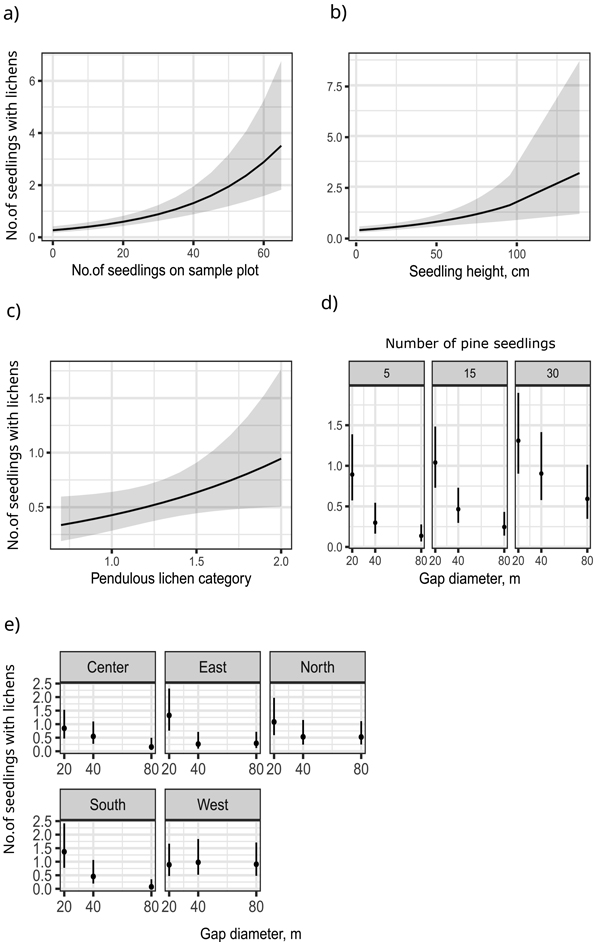
Fig. 4. Model 1 predictions and 95% confidence intervals for the number of pendulous lichen-colonized seedlings in the function of the following explanatory variables: number of Scots pine seedlings on a circular sample plot (a), Scots pine seedling height (b), pendulous lichen category at the forest edge (c), the interaction of gap size and number of seedlings at given values of 5, 15 and 30 seedlings in a sample plot (d), and interaction of gap size and direction (e). Pendulous lichen category comes from the pendulous lichen assessed from five nearest dominant trees in each cardinal direction within each gap (following the methods described by Kumpula et al. (2006).
| Table 2. Generalized linear mixed model to explain the number of pendulous lichen-colonized seedlings using a negative binomial (Model 1) (NB2-parametrization) distribution assumption. VIF denotes the variance inflation factor values for the main effects of the predictors. The marginal model R2 = 52.3%. | |||||
| Variable | Estimate | Std.error | z-/chi-value | p | VIF |
| Fixed effects | |||||
| (Intercept) | –1.904 | 0.655 | –2.909 | 0.004 | |
| Gap diameter, m (20 m being ref. category) | 12.961 | 0.002 | 1.23 | ||
| 40 m | –0.936 | 0.514 | –1.820 | 0.069 | |
| 80 m | –2.430 | 0.695 | –3.494 | <0.001 | |
| Direction (Center being ref. category) | 2.668 | 0.615 | 1.45 | ||
| North | 0.246 | 0.392 | 0.627 | 0.531 | |
| East | 0.447 | 0.374 | 1.196 | 0.232 | |
| South | 0.479 | 0.383 | 1.251 | 0.211 | |
| West | 0.045 | 0.396 | 0.114 | 0.909 | |
| No of seedlings on circular sample plot (5 m2) | 0.015 | 0.009 | 1.717 | 0.086 | 1.07 |
| Height of seedlings, cm | 0.016 | 0.005 | 3.532 | <0.001 | 1.36 |
| Mean of pendulous lichen category (categories 0–3) | 0.794 | 0.393 | 2.022 | 0.043 | 1.07 |
| Gap diameter * No of seedlings on plot | 8.592 | 0.014 | |||
| 40 m | 0.029 | 0.015 | 1.877 | 0.061 | |
| 80 m | 0.043 | 0.016 | 2.744 | 0.006 | |
| Gap diameter * Direction | 18.448 | 0.018 | |||
| 40 m * North | –0.276 | 0.615 | –0.449 | 0.654 | |
| 80 m * North | 0.959 | 0.754 | 1.271 | 0.204 | |
| 40 m * East | –1.173 | 0.674 | –1.741 | 0.082 | |
| 80 m * East | 0.172 | 0.781 | 0.221 | 0.825 | |
| 40 m * South | –0.666 | 0.632 | –1.053 | 0.292 | |
| 80 m * South | –1.244 | 1.015 | –1.225 | 0.220 | |
| 40 m * West | 0.532 | 0.583 | 0.913 | 0.361 | |
| 80 m * West | 1.701 | 0.730 | 2.331 | 0.020 | |
| Random effects | Variance | ||||
| Block | 0.085 | ||||
| Gap nested within Block | <0.001 | ||||
| Theta (NB2 parameter) | 2.720 | ||||
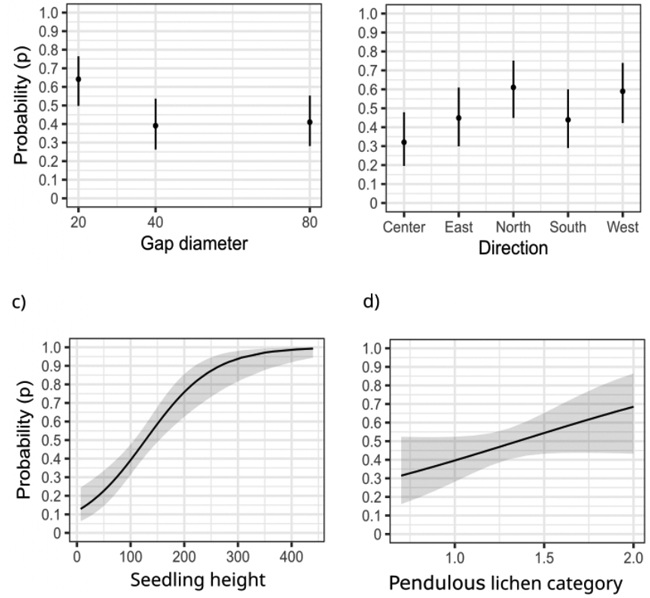
Fig. 5. Model 2 predictions and 95% confidence intervals for pendulous lichen colonization on the tallest seedlings: effect of gap diameter (m) (a), direction (b), height (cm) of the tallest seedling (c), and pendulous lichen category (mean of 10 trees) (d). Pendulous lichen category comes from the pendulous lichen assessed from five nearest dominant trees in each cardinal direction within each gap (following the methods described by Kumpula et al. 2006).
| Table 3. Generalized linear mixed-effects based on a binomial (Bernoulli) distribution for the presence of pendulous lichens on the tallest seedling (Model 2). VIF denotes the variance inflation factor values for the main effects of the predictors. The marginal model R2 = 33.6%. The area under the ROC-curve = 0.745 (marginal model). | |||||
| Variable | Estimate | Std.error | z-/chi-value | p | VIF |
| Fixed effects | |||||
| Intercept | –3.563 | 1.034 | –3.447 | 0.001 | |
| Gap diameter, m (20 m being ref. category) | 7.033 | 0.030 | 1.09 | ||
| 40 m | –1.014 | 0.423 | –2.399 | 0.016 | |
| 80 m | –0.934 | 0.423 | –2.209 | 0.027 | |
| Direction (Center being ref. category) | 8.931 | 0.063 | 1.06 | ||
| North | 1.190 | 0.457 | 2.605 | 0.009 | |
| East | 0.543 | 0.453 | 1.198 | 0.231 | |
| South | 0.504 | 0.451 | 1.117 | 0.264 | |
| West | 1.104 | 0.467 | 2.366 | 0.018 | |
| Mean of pendulous lichen category (categories 0–3) | 1.186 | 0.700 | 1.693 | 0.090 | 1.03 |
| Height of the longest seedling, cm | 0.016 | 0.003 | 4.791 | < 0.001 | 1.11 |
| Random effects | Variance | ||||
| Block | <0.001 | ||||
| Gap nested within Block | 0.428 | ||||
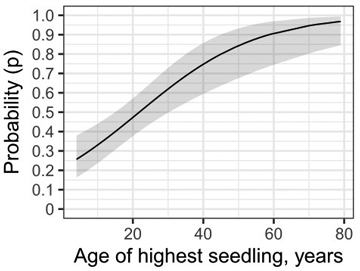
Fig. 6. Model 2 (alternative model) predictions and 95% confidence intervals for pendulous lichen colonization on the tallest seedlings when seedling height was replaced with seedling age.
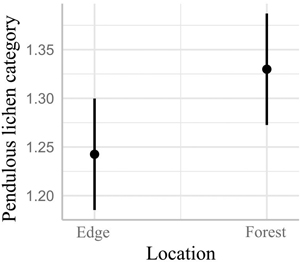
Fig. 7. Model 3 predictions and 95% confidence intervals for the abundance of pendulous lichens, as indicated by the pendulous lichen category, in the forest edge and interior.