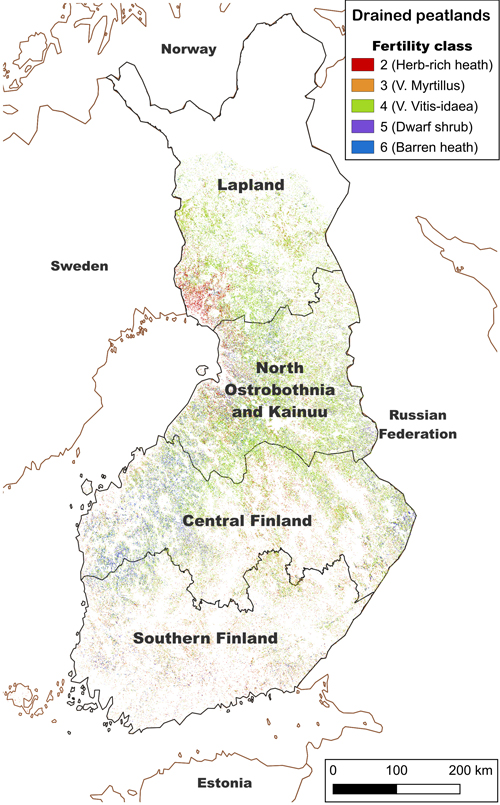
Fig. 1. Study regions and presence of productive (annual growth greater than 1 m3 ha–1 yr–1) drained peatland forests classified by fertility class. Administrative boundaries from the National Land Survey of Finland, 4/2024. Peatland fertility map: Geological Survey of Finland (GTK) (2024) open license CC BY 4.0, including GTK’s data of peatland fertility levels in Finland 1.0/2023, imported from the Hakku service on July 31, 2024.
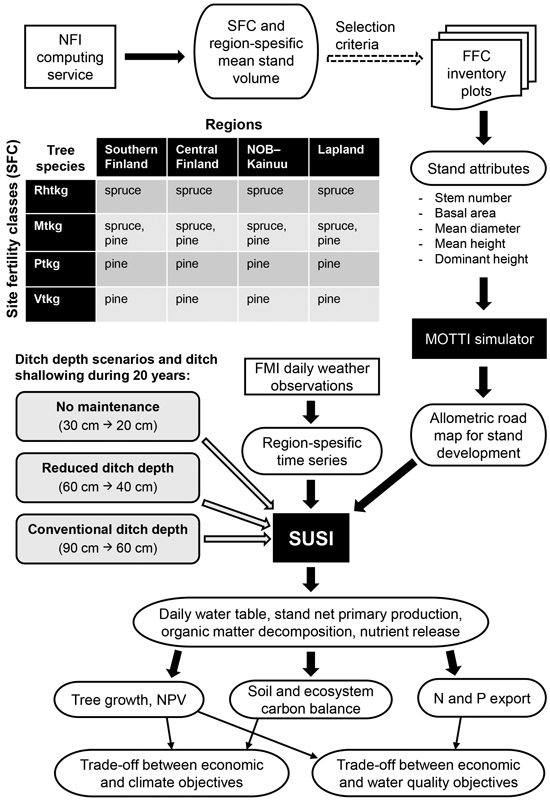
Fig. 2. Study procedure. First, the representative forest attribute data were derived from the Finnish Forest Centre (FFC) inventory plots for 20 forest stands, as shown in the table. Details of the allometric roadmap processed by the MOTTI simulator can be found in Laurén et al. (2021), section 2.3.8. Three ditch depth scenarios were simulated for all study sites. SUSI calculates daily hydrological and biogeochemical fluxes of the ecosystem, which are derived into economic and environmental indicators and their trade-offs.
| Table 1. Total area, area of productive (annual growth greater than 1 m3 ha–1 yr–1) peatland forests and mean volume of productive peatland forests of different site fertility classes (SFC) in different regions. SFCs were classified according to Vasander and Laine (2008). Data derived from the NFI computing service (Natural Resources Institute Finland 2023). | |||||
| Region | SFC | Abbreviation | Total area [ha] | Productive forests [ha] | Mean volume [m3 ha–1] |
| Southern Finland (SF) | Herb-rich heath | Rhtkg | 151 255 | 145 041 | 177 |
| Vaccinium myrtillus | Mtkg | 313 263 | 299 173 | 168 | |
| V. vitis-idaea | Ptkg | 204 703 | 194 034 | 135 | |
| Dwarf shrub | Vtkg | 121 811 | 95 130 | 95 | |
| Central Finland (CF) | Herb-rich heath | Rhtkg | 149 554 | 139 549 | 153 |
| V. myrtillus | Mtkg | 445 609 | 415 501 | 146 | |
| V. vitis-idaea | Ptkg | 521 154 | 467 359 | 122 | |
| Dwarf shrub | Vtkg | 371 867 | 243 159 | 83 | |
| North Ostrobothnia–Kainuu (NOB–K) | Herb-rich heath | Rhtkg | 106 670 | 80 914 | 116 |
| V. myrtillus | Mtkg | 372 538 | 264 537 | 130 | |
| V. vitis-idaea | Ptkg | 669 930 | 401 992 | 107 | |
| Dwarf shrub | Vtkg | 378 863 | 157 673 | 71 | |
| Lapland | Herb-rich heath | Rhtkg | 63 870 | 45 495 | 90 |
| V. myrtillus | Mtkg | 121 036 | 80 652 | 119 | |
| V. vitis-idaea | Ptkg | 369 941 | 197 602 | 81 | |
| Dwarf shrub | Vtkg | 213 000 | 45 371 | 52 | |
| Table 2. Forest attributes representing average forest characteristics in different regions and site fertility classes (SFC), calculated from Finnish Forest Centre inventory plots (FFC 2023). SF = Southern Finland, CF = Central Finland, NOB–K = North Ostrobothnia–Kainuu, N = number of stems, BA = basal area, Dg = basal area-weighted mean diameter, Hg = basal area-weighted mean height, Hdom = dominant height, VOL = stem volume. SFCs were classified according to Vasander and Laine (2008). The * indicates the extended range of selection by stand volume due to lack of similar field plots. | ||||||||
| Region | SFC and dominant tree species | FFC plots | N [ha–1] | BA [m2 ha–1] | Dg [cm] | Hg [m] | Hdom [m] | VOL [m3 ha–1] |
| SF | Rhtkg (spruce) | 6 | 1073 | 22.6 | 20.3 | 16.4 | 19.2 | 178 |
| Mtkg (spruce) | 14 | 851 | 20.2 | 21.3 | 17.4 | 19.7 | 169 | |
| Mtkg (pine) | 16 | 932 | 19.8 | 22.0 | 17.9 | 20.2 | 168 | |
| Ptkg (pine) | 44 | 915 | 16.8 | 20.2 | 16.6 | 18.6 | 134 | |
| Vtkg (pine) | 11 | 1156 | 15.1 | 15.0 | 12.3 | 14.4 | 94 | |
| CF | Rhtkg (spruce) | 4 | 903 | 21.1 | 21.8 | 15.3 | 17.9 | 149 |
| Mtkg (spruce) | 21 | 1111 | 19.2 | 18.9 | 15.6 | 18.4 | 144 | |
| Mtkg (pine) | 13 | 1391 | 20.5 | 17.3 | 14.7 | 17.4 | 147 | |
| Ptkg (pine) | 78 | 872 | 16.1 | 18.9 | 15.6 | 17.7 | 122 | |
| Vtkg (pine) | 34 | 1015 | 13.6 | 15.7 | 12.2 | 14.3 | 84 | |
| NOB–K | Rhtkg (spruce) | 5 | 1420 | 20.0 | 18.1 | 12.7 | 15.4 | 120 |
| Mtkg (spruce) | 7 | 1328 | 19.1 | 17.9 | 14.1 | 17.0 | 130 | |
| Mtkg (pine) | 41 | 1296 | 19.0 | 17.2 | 14.1 | 16.4 | 132 | |
| Ptkg (pine) | 44 | 1131 | 16.0 | 16.4 | 13.3 | 15.5 | 106 | |
| Vtkg (pine) | 18 | 1266 | 12.9 | 13.9 | 10.8 | 12.8 | 71 | |
| Lapland | Rhtkg (spruce) | 3* | 1637 | 20.6 | 16.5 | 11.4 | 13.8 | 113 |
| Mtkg (spruce) | 3* | 1824 | 19.3 | 16.2 | 12.7 | 15.6 | 118 | |
| Mtkg (pine) | 15 | 1904 | 20.2 | 14.6 | 11.6 | 14.0 | 119 | |
| Ptkg (pine) | 5 | 2224 | 16.4 | 12.3 | 9.5 | 12.3 | 81 | |
| Vtkg (pine) | 3* | 2083 | 12.4 | 10.6 | 8.2 | 10.2 | 55 | |
| Table 3. Annual and midsummer (July–August) weather statistics in our study regions. SF = Southern Finland, CF = Central Finland, NOB–K = North Ostrobothnia–Kainuu. | |||||
| SF | CF | NOB–K | Lapland | ||
| Annual mean temperature (°C) | min. | 3.2 | 1.7 | 1.0 | –0.7 |
| mean | 5.1 | 3.8 | 2.9 | 1.5 | |
| max. | 6.8 | 5.4 | 4.5 | 2.8 | |
| July–August mean temperature (°C) | min. | 14.5 | 13.4 | 13.1 | 12.5 |
| mean | 16.3 | 15.2 | 15.0 | 14.5 | |
| max. | 18.7 | 17.6 | 17.1 | 16.9 | |
| Annual rainfall (mm) | min. | 434 | 441 | 406 | 387 |
| mean | 644 | 663 | 621 | 539 | |
| max. | 814 | 857 | 786 | 754 | |
| July–August rainfall (mm) | min. | 69 | 30 | 34 | 26 |
| mean | 148 | 170 | 168 | 130 | |
| max. | 288 | 276 | 303 | 239 | |
| Annual solar radiation (MJ m–2) | min. | 3053 | 2933 | 2887 | 2613 |
| mean | 3409 | 3200 | 3145 | 2895 | |
| max. | 3659 | 3583 | 3475 | 3107 | |
| July–August solar radiation (MJ m–2) | min. | 925 | 866 | 825 | 781 |
| mean | 1034 | 998 | 980 | 901 | |
| max. | 1181 | 1209 | 1151 | 1081 | |
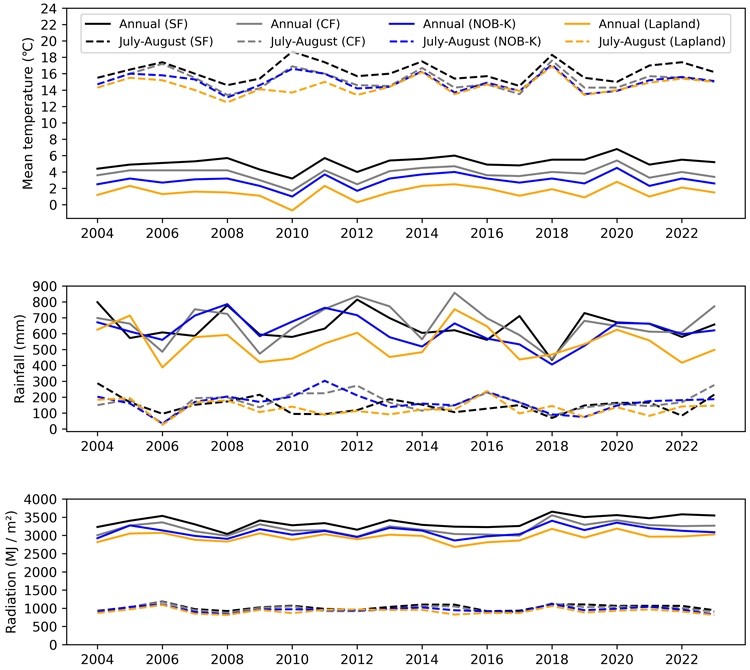
Fig. 3. Annual and midsummer (July–August) temperature, precipitation, and solar radiation during the 20-year simulation period in our study regions. SF = Southern Finland, CF = Central Finland, NOB–K = North Ostrobothnia–Kainuu.
| Table 4. Average water table below the soil surface during the growing season (May–October) in different regions, site fertility classes (SFC) and scenarios: NO_DNM = no ditch network maintenance, DNM60 = reduced ditch depth of 60 cm, DNM90 = conventional ditch depth of 90 cm. SF = Southern Finland, CF = Central Finland, NOB–K = North Ostrobothnia–Kainuu. SFCs were classified according to Vasander and Laine (2008). | ||||
| Region | SFC | NO_DNM [m] | DNM_60 [m] | DNM_90 [m] |
| SF | Rhtkg | –0.47 | –0.55 | –0.73 |
| SF | Mtkg (spruce) | –0.49 | –0.66 | –0.95 |
| SF | Mtkg (pine) | –0.43 | –0.75 | –1.09 |
| SF | Ptkg | –0.35 | –0.57 | –0.89 |
| SF | Vtkg | –0.26 | –0.41 | –0.67 |
| CF | Rhtkg | –0.38 | –0.51 | –0.72 |
| CF | Mtkg (spruce) | –0.34 | –0.41 | –0.53 |
| CF | Mtkg (pine) | –0.32 | –0.51 | –0.80 |
| CF | Ptkg | –0.27 | –0.37 | –0.54 |
| CF | Vtkg | –0.19 | –0.27 | –0.41 |
| NOB–K | Rhtkg | –0.30 | –0.35 | –0.45 |
| NOB–K | Mtkg (spruce) | –0.28 | –0.31 | –0.39 |
| NOB–K | Mtkg (pine) | –0.25 | –0.39 | –0.62 |
| NOB–K | Ptkg | –0.22 | –0.29 | –0.41 |
| NOB–K | Vtkg | –0.14 | –0.20 | –0.30 |
| Lapland | Rhtkg | –0.26 | –0.34 | –0.49 |
| Lapland | Mtkg (spruce) | –0.25 | –0.30 | –0.40 |
| Lapland | Mtkg (pine) | –0.23 | –0.34 | –0.52 |
| Lapland | Ptkg | –0.20 | –0.27 | –0.36 |
| Lapland | Vtkg | –0.14 | –0.21 | –0.31 |
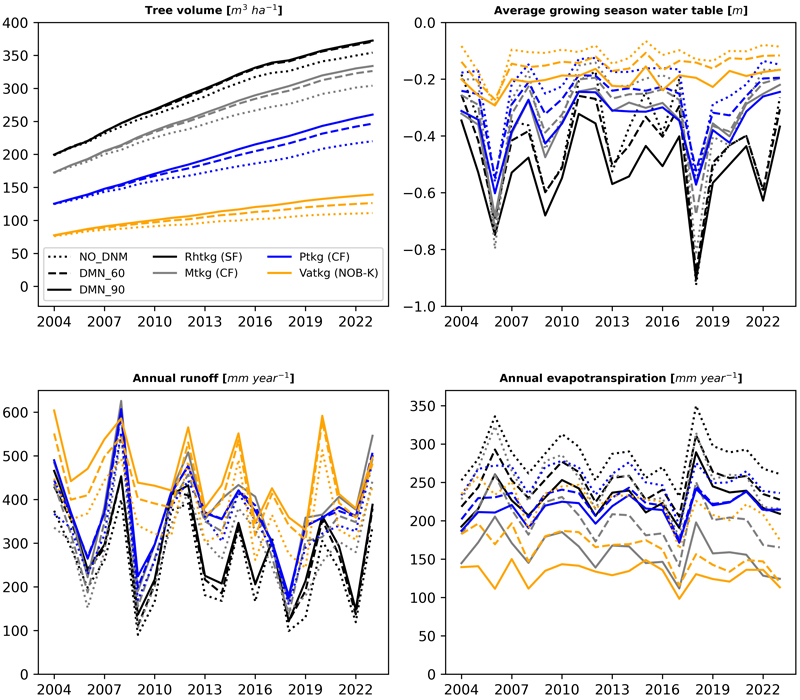
Fig. 4. Tree volume development, variation of the average growing season (May–October) water table below the soil surface, and annual water runoff and evapotranspiration during the 20-year simulation period in four example sites: a spruce-dominated herb-rich heath forest (Rhtkg) in southern Finland (SF), a spruce-dominated Vaccinium myrtillus-type peatland forest (Mtkg) and a pine-dominated V. vitis-idaea-type peatland forest (Ptkg) in central Finland (CF), and a nutrient-poor dwarf-shrub peatland forest (Vatkg) in the North Ostrobothnia–Kainuu region (NOB–K). Scenarios: NO_DNM = no ditch network maintenance, DNM_60 = reduced ditch depth of 60 cm, NDM_90 = conventional ditch depth of 90 cm.
| Table 5. Average forest volume growth in different regions, site fertility classes (SFC) and scenarios: NO_DNM = no ditch network maintenance, DNM60 = reduced ditch depth of 60 cm, DNM90 = conventional ditch depth of 90 cm. The net present value of ditch network maintenance (NPVDNM) in scenarios DNM_60 and DNM_90 was calculated using discount rates of 2%, 3% and 4%. NPVDNM was not calculated for scenarios with a negative volume growth response to DNM. SF = Southern Finland, CF = Central Finland, NOB–K = North Ostrobothnia–Kainuu. SFCs were classified according to Vasander and Laine (2008). | ||||||||||
| Region | SFC | Volume growth [m3 ha–1 yr–1] | NPVDNM [€ ha–1] (2%) | NPVDNM [€ ha–1] (3%) | NPVDNM [€ ha–1] (4%) | |||||
| NO_DNM | DNM_60 | DNM_90 | DNM_60 | DNM_90 | DNM_60 | DNM_90 | DNM_60 | DNM_90 | ||
| SF | Rhtkg | 8.7 | 8.9 | 8.1 | –94 € | –133 € | –164 € | |||
| SF | Mtkg (spruce) | 10.3 | 10.0 | 8.7 | ||||||
| SF | Mtkg (pine) | 6.9 | 6.5 | 6.0 | ||||||
| SF | Ptkg | 7.7 | 8.2 | 7.5 | 205 € | 113 € | 38 € | |||
| SF | Vtkg | 5.3 | 6.1 | 6.2 | 338 € | 366 € | 223 € | 246 € | 129 € | 148 € |
| CF | Rhtkg | 7.6 | 8.2 | 7.6 | 169 € | 83 € | 14 € | |||
| CF | Mtkg (spruce) | 7.9 | 8.8 | 8.8 | 489 € | 544 € | 347 € | 392 € | 231 € | 268 € |
| CF | Mtkg (pine) | 6.1 | 6.6 | 6.3 | 258 € | –31 € | 157 € | –81 € | 74 € | –122 € |
| CF | Ptkg | 5.9 | 7.0 | 7.3 | 648 € | 882 € | 477 € | 670 € | 338 € | 497 € |
| CF | Vtkg | 3.6 | 4.8 | 5.6 | 572 € | 1124 € | 415 € | 869 € | 287 € | 661 € |
| NOB–K | Rhtkg | 5.5 | 6.3 | 6.3 | 433 € | 529 € | 301 € | 380 € | 193 € | 258 € |
| NOB–K | Mtkg (spruce) | 6.0 | 6.9 | 7.1 | 460 € | 658 € | 323 € | 486 € | 211 € | 345 € |
| NOB–K | Mtkg (pine) | 5.7 | 6.6 | 6.7 | 500 € | 558 € | 356 € | 404 € | 238 € | 278 € |
| NOB–K | Ptkg | 4.8 | 5.8 | 6.2 | 491 € | 811 € | 349 € | 612 € | 232 € | 449 € |
| NOB–K | Vtkg | 2.5 | 3.4 | 4.1 | 297 € | 775 € | 189 € | 582 € | 101 € | 425 € |
| Lapland | Rhtkg | 4.1 | 4.8 | 4.8 | 298 € | 293 € | 190 € | 185 € | 101 € | 98 € |
| Lapland | Mtkg (spruce) | 3.9 | 4.7 | 4.9 | 263 € | 417 € | 161 € | 288 € | 78 € | 182 € |
| Lapland | Mtkg (pine) | 3.6 | 4.3 | 4.6 | 184 € | 351 € | 96 € | 233 € | 24 € | 137 € |
| Lapland | Ptkg | 2.9 | 3.6 | 3.9 | 86 € | 234 € | 15 € | 137 € | –42 € | 58 € |
| Lapland | Vtkg | 1.5 | 2.2 | 2.7 | –5 € | 191 € | –60 € | 102 € | –104 € | 29 € |
| Table 6. Average annual soil and ecosystem (soil + biomass) CO2-equivalent greenhouse gas (GHG) balances in different regions, site fertility classes (SFC) and scenarios: NO_DNM = no ditch network maintenance, DNM60 = reduced ditch depth of 60 cm, DNM90 = conventional ditch depth of 90 cm. A negative value indicates a loss of carbon in soil or biomass (carbon source), and a positive value indicates an addition of carbon storage in forest ecosystem (carbon sink). Trade-offs between net present value (NPV) and increased soil GHG emissions (TO NPV GHG) were calculated using a discount rate of 3%. SF = Southern Finland, CF = Central Finland, NOB–K = North Ostrobothnia–Kainuu. SFCs were classified according to Vasander and Laine (2008). | |||||||||
| Region | SFC | Soil GHG balance [kg ha–1 yr–1] | TO NPV GHG (3%) | Ecosystem GHG balance [kg ha–1 yr–1] | |||||
| NO_DNM | DNM_60 | DNM_90 | DNM_60 | DNM_90 | NO_DNM | DNM_60 | DNM_90 | ||
| SF | Rhtkg | –6860 | –8220 | –10 570 | 2120 | 1030 | –2150 | ||
| SF | Mtkg (spruce) | –6530 | –8850 | –12 070 | 3980 | 1410 | –3100 | ||
| SF | Mtkg (pine) | –5720 | –9610 | –13 230 | 1340 | –2950 | –7130 | ||
| SF | Ptkg | –4260 | –6880 | –10 840 | 2 € | 3750 | 1650 | –2980 | |
| SF | Vtkg | –2910 | –5200 | –8470 | 5 € | 2 € | 2670 | 1800 | –1380 |
| CF | Rhtkg | –5600 | –7350 | –10 070 | 2 € | 2420 | 1370 | –1990 | |
| CF | Mtkg (spruce) | –4450 | –5440 | –7280 | 17 € | 7 € | 3650 | 3580 | 1840 |
| CF | Mtkg (pine) | –3980 | –6110 | –9640 | 4 € | 2270 | 720 | –3090 | |
| CF | Ptkg | –3160 | –4690 | –7040 | 16 € | 9 € | 3050 | 2680 | 680 |
| CF | Vtkg | –1830 | –3240 | –5220 | 15 € | 13 € | 1830 | 1720 | 520 |
| NOB–K | Rhtkg | –3830 | –4770 | –6450 | 16 € | 7 € | 2380 | 2310 | 760 |
| NOB–K | Mtkg (spruce) | –3020 | –3750 | –5080 | 22 € | 12 € | 3560 | 3790 | 2750 |
| NOB–K | Mtkg (pine) | –3360 | –5270 | –8230 | 9 € | 4 € | 2550 | 1640 | –1210 |
| NOB–K | Ptkg | –2110 | –3410 | –5160 | 13 € | 10 € | 2990 | 2750 | 1520 |
| NOB–K | Vtkg | –1010 | –2280 | –3820 | 7 € | 10 € | 1550 | 1240 | 520 |
| Lapland | Rhtkg | –2800 | –4110 | –6200 | 7 € | 3 € | 2110 | 1640 | –400 |
| Lapland | Mtkg (spruce) | –1840 | –2850 | –4320 | 8 € | 6 € | 2640 | 2520 | 1330 |
| Lapland | Mtkg (pine) | –2300 | –4070 | –6400 | 3 € | 3 € | 1620 | 600 | –1420 |
| Lapland | Ptkg | –1220 | –2530 | –3960 | 1 € | 2 € | 1970 | 1510 | 420 |
| Lapland | Vtkg | –670 | –2090 | –3650 | 2 € | 1080 | 410 | –580 | |
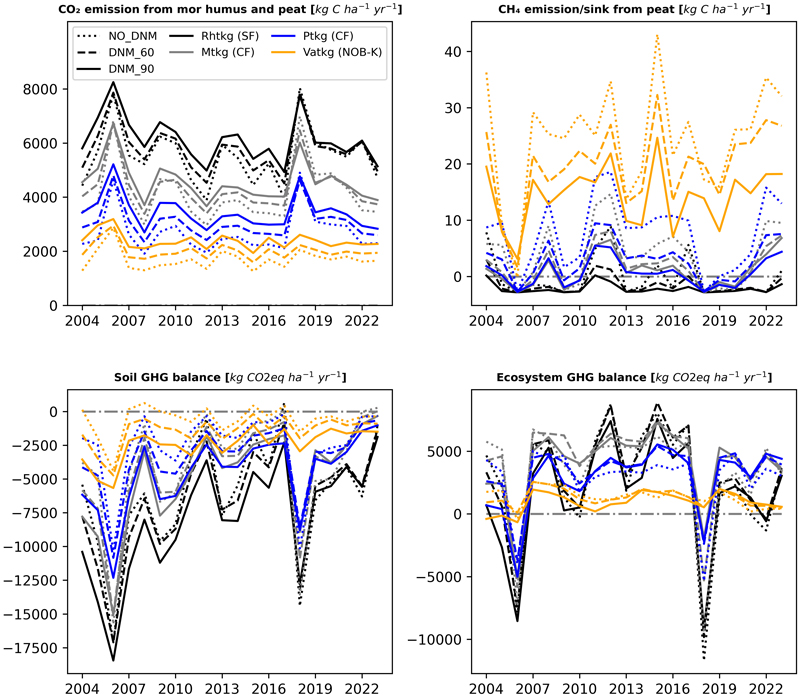
Fig. 5. Annual CO2 and CH4 emissions, and CO2-equivalent soil and ecosystem (soil + biomass) greenhouse gas (GHG) balance during the 20-year simulation period in four example sites (see Fig. 4).
| Table 7. Average annual nitrogen (N) and phosphorus (P) export in different regions, site fertility classes (SFC) and scenarios: NO_DNM = no ditch network maintenance, DNM60 = reduced ditch depth of 60 cm, DNM90 = conventional ditch depth of 90 cm. SF = Southern Finland, CF = Central Finland, NOB–K = North Ostrobothnia–Kainuu. SFCs were classified according to Vasander and Laine (2008). | |||||||
| Region | SFC | N export [kg ha–1 yr–1] | P export [kg ha–1 yr–1] | ||||
| NO_DNM | DNM_60 | DNM_90 | NO_DNM | DNM_60 | DNM_90 | ||
| SF | Rhtkg | 4.95 | 6.53 | 8.94 | 1.05 | 1.20 | 1.48 |
| SF | Mtkg (spruce) | 3.48 | 4.45 | 7.05 | 0.67 | 0.70 | 1.00 |
| SF | Mtkg (pine) | 2.09 | 5.36 | 10.39 | 0.40 | 0.90 | 1.50 |
| SF | Ptkg | 1.79 | 2.32 | 4.37 | 0.22 | 0.26 | 0.45 |
| SF | Vtkg | 1.25 | 1.96 | 3.07 | 0.13 | 0.19 | 0.30 |
| CF | Rhtkg | 3.59 | 4.87 | 7.46 | 0.87 | 0.97 | 1.24 |
| CF | Mtkg (spruce) | 2.04 | 2.39 | 3.67 | 0.52 | 0.58 | 0.71 |
| CF | Mtkg (pine) | 1.92 | 2.42 | 4.44 | 0.38 | 0.41 | 0.73 |
| CF | Ptkg | 1.17 | 1.63 | 2.47 | 0.17 | 0.21 | 0.27 |
| CF | Vtkg | 0.65 | 0.92 | 1.62 | 0.06 | 0.09 | 0.15 |
| NOB–K | Rhtkg | 1.77 | 2.50 | 4.27 | 0.64 | 0.75 | 0.93 |
| NOB–K | Mtkg (spruce) | 1.10 | 1.32 | 2.34 | 0.35 | 0.43 | 0.55 |
| NOB–K | Mtkg (pine) | 1.37 | 1.75 | 3.28 | 0.29 | 0.31 | 0.50 |
| NOB–K | Ptkg | 0.62 | 1.11 | 1.89 | 0.10 | 0.15 | 0.22 |
| NOB–K | Vtkg | 0.15 | 0.49 | 1.05 | 0.01 | 0.04 | 0.09 |
| Lapland | Rhtkg | 1.38 | 2.20 | 3.93 | 0.50 | 0.62 | 0.77 |
| Lapland | Mtkg (spruce) | 0.78 | 1.16 | 2.07 | 0.25 | 0.35 | 0.47 |
| Lapland | Mtkg (pine) | 1.07 | 1.54 | 2.24 | 0.32 | 0.30 | 0.35 |
| Lapland | Ptkg | 0.30 | 0.80 | 1.44 | 0.05 | 0.12 | 0.19 |
| Lapland | Vtkg | 0.08 | 0.48 | 1.06 | 0.01 | 0.04 | 0.10 |