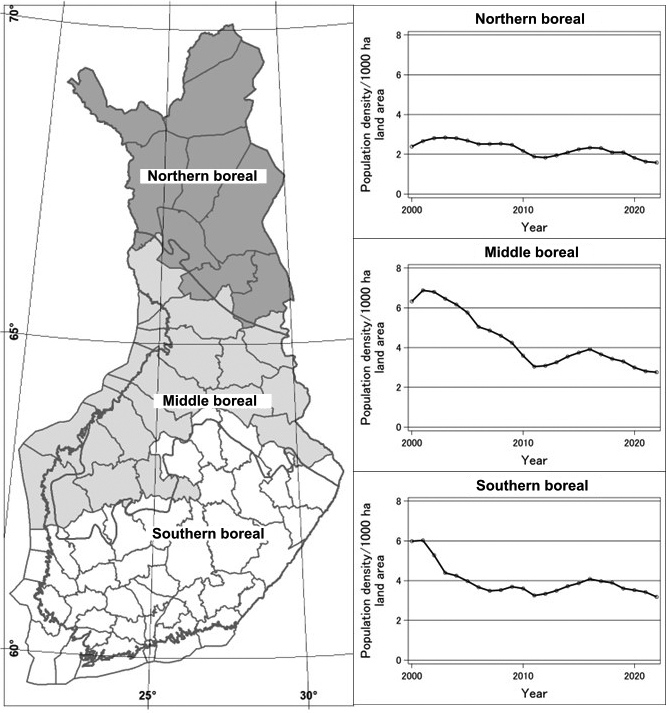
Fig. 1. Delineation of the three regions, which follow the vegetation zones while adhering to the administrative borders of the moose management areas in Finland. The vegetation zones are indicated by smooth lines on the map, with the small hemi-boreal areas in southwestern Finland included in the southern boreal zone. For each region, variation in moose population density during 2000–2022 is presented based on Luke’s official moose population estimates (Pusenius et al. 2024).
| Table 1. Description and explanation of National Forest Inventory moose (Alces alces L.) damage variables applied in this study (Nikula et al. 2021). | ||
| Variable | Description | Additional explanation |
| Damage symptoms | Visual assessment of the injury | In case of moose damage: broken or dry top (in the upper half of the crown), technical defects on stem, other crown malformations, defoliation. |
| Degree of damage | Apparent severity of damage at the stand level which was evaluated by change in silvicultural quality of the stand, see next variable row. Damage classes 1, 2 and 3 were utilized. | 0 mild damage, symptoms observed, but the damage does not reduce the silvicultural quality of the stand; 1 intermediate, the stand quality is reduced by one class; 2 severe, the stand quality is reduced by more than one class; 3 total, artificial regeneration is required. |
| Silvicultural quality of the stand | The division was based on species composition, dominant height, even spatial distribution, density and technical quality of the dominant tree storey. | 1 good 2 satisfactory 3 adequate 4 low-productive: the yield is so low that the stand should be regenerated before maturity. |
| Age of damage | The time when the damage has started and the possible continuing effect of the cause in the stand. In this study damage age classes 0, 1 and 3 were utilized which means that there was fresh damage at inventory year. | 0 started less than two years ago; 1 started 2–5 years ago and still continuing; 2 started 2–5 years ago, but ceased; 3 started more than 5 years ago and still continuing; 4 started more than 5 years ago but ceased. |
| Table 2. Forest characteristics of the seedling stands that were artificially regenerated for Scots pine and recorded on permanent sample plots in the 10th National Forest Inventory (NFI10, 2004–2008), shown both for NFI10 and the remeasurement in the 13th National Forest Inventory (NFI13, 2019–2023). | ||||||
| Young seedling stands in NFI10 | ||||||
| NFI | Variable | N | Mean | Std Dev | Minimum | Maximum |
| NFI10 | Mean height, dm | 228 | 5.8 | 17.3 | 1 | 13 |
| Stand age, yr | 227 | 5.4 | 14.3 | 1 | 23 | |
| Number of seedlings, pcs ha–1 | 228 | 2335 | 4114 | 300 | 5700 | |
| Number of all seedlings, pcs ha –1 | 228 | 10 536 | 42 390 | 1000 | 81 000 | |
| NFI13 | Mean height, dm | 228 | 63.5 | 130.2 | 3 | 153 |
| Mean diameter, cm | 227 | 7.3 | 15.3 | 0 | 17 | |
| Stand age, yr | 228 | 20.4 | 30.0 | 11 | 65 | |
| Number of seedlings, pcs ha –1 | 124* | 1965 | 3066 | 350 | 3800 | |
| Number of all seedlings, pcs ha –1 | 124* | 5566 | 19 107 | 500 | 20 000 | |
| Advanced seedling stands in NFI10 | ||||||
| NFI | Variable | N | Mean | Std Dev | Minimum | Maximum |
| NFI10 | Mean height, dm | 331 | 34.4 | 68.9 | 14 | 80 |
| Stand age, yr | 331 | 15.0 | 24.2 | 5 | 36 | |
| Number of seedlings, pcs ha–1 | 331 | 1994 | 3098 | 100 | 5100 | |
| Number of all seedlings, pcs ha–1 | 331 | 8301 | 32 455 | 0 | 56 000 | |
| NFI13 | Mean height, dm | 331 | 108.3 | 110.0 | 45 | 184 |
| Mean diameter, cm | 331 | 12.8 | 12.6 | 4 | 25 | |
| Stand age, yr | 331 | 30.5 | 33.5 | 16 | 69 | |
| Number of seedlings, pcs ha–1 | 12* | 2116 | 1791 | 1700 | 3094 | |
| Number of all seedlings, pcs ha–1 | 12* | 5575 | 18 683 | 2100 | 15 450 | |
| * Number of seedlings is measured only in seedling stands. | ||||||
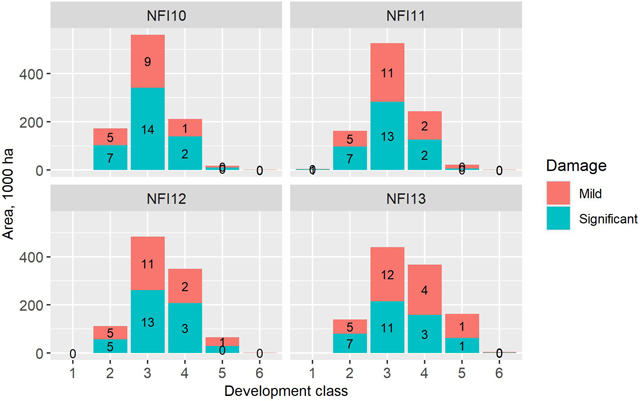
Fig. 2. Area and proportion (labels on bars, %) of moose damage by development class and damage severity in four consecutive National Forest Inventories (NFIs) conducted in Finland: NFI10 (2004–2008), NFI11 (2009–2013), NFI12 (2014–2018), and NFI13 (2019–2023). Development classes are: 1 = regeneration stand (open, seeding, or shelter stand), 2 = young seedling stand, 3 = advanced seedling stand, 4 = young thinning stand, 5 = advanced thinning stand, and 6=mature stand.
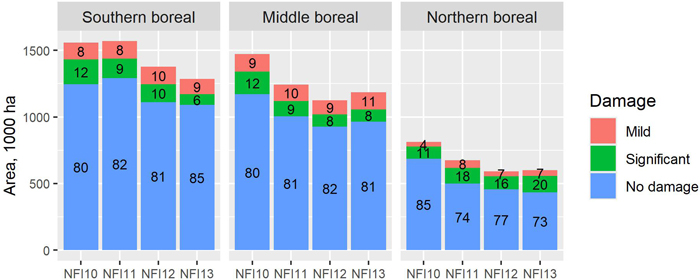
Fig. 3. Area and proportion (labels on bars, %) of moose damage in seedling stands (young and advanced) by damage severity and vegetation zone in Finland in four consecutive National Forest Inventories (NFIs): NFI10 (2004–2008), NFI11 (2009–2013), NFI12 (2014–2018), and NFI13 (2019–2023).
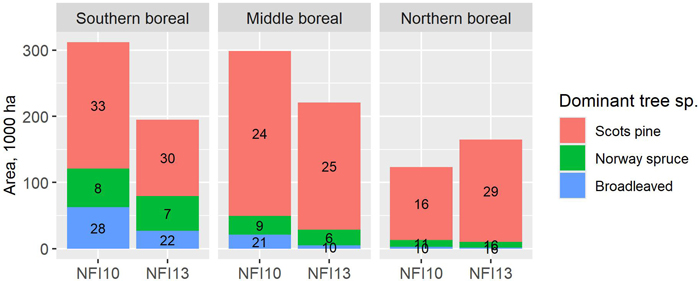
Fig. 4. Area and proportion (labels on bars, %) of moose damage in seedling stands (young and advanced) by dominant tree species and vegetation zone in Finland according to the 10th National Forest Inventory (NFI10, 2004–2008) and the 13th National Forest Inventory (NFI13, 2019–2023). Moose damage includes both mild and significant damage. Proportions were calculated as a percentage of the total area dominated by the respective tree species.
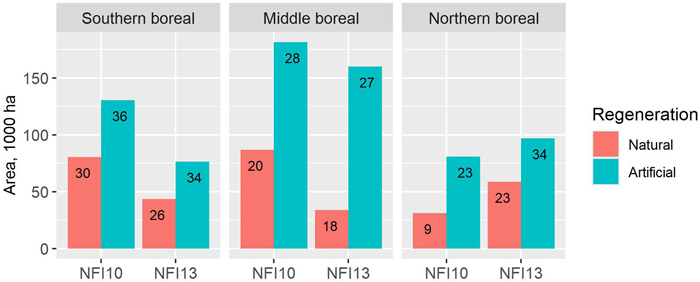
Fig. 5. Area and proportion (labels on bars, %) of moose damage in seedling stands regenerated for Scots pine, by regeneration method and vegetation zone in Finland, according to the 10th National Forest Inventory (NFI10, 2004–2008) and the 13th National Forest Inventory (NFI13, 2019–2023). Moose damage includes both mild and significant damage, and seedling stands comprise both young and advanced seedling stands. Proportions were calculated as a percentage of the total area of Scots pine seedling stands regenerated using each method.
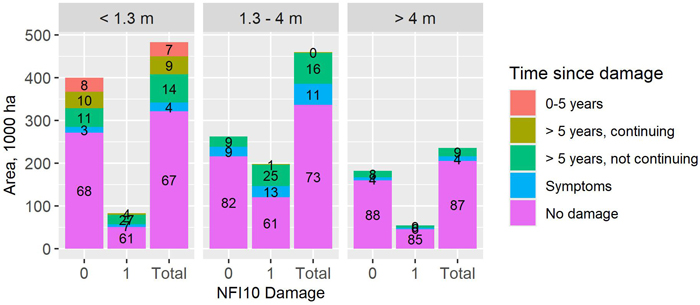
Fig. 6. Area and proportion (labels on bars, %) of moose damage in the 13th National Forest Inventory (NFI13, 2019–2023) in seedling stands artificially regenerated for Scots pine, by development class (young seedling stand, mean height < 1.3 m; advanced seedling stand, mean height 1.3–4 m; and advanced seedling stand, mean height > 4 m), damage class in the 10th National Forest Inventory (NFI10, 2004–2008) (0 = no moose damage observed, 1 = moose damage, Total = all stands), and time since moose damage recorded in NFI13.
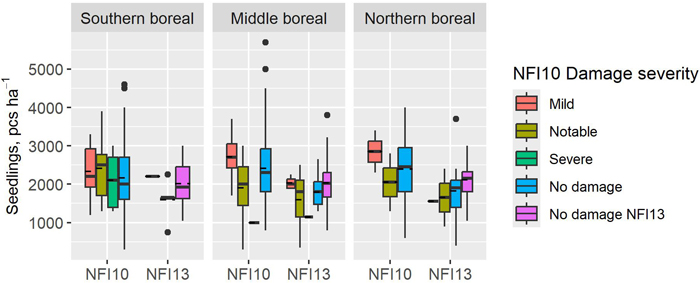
Fig. 7. Number of crop seedlings in young seedling stands, artificially regenerated for Scots pine, by damage severity class in the 10th National Forest Inventory (NFI10) and by vegetation zone in Finland, measured in NFI10 (2004–2008) and remeasured in the 13th National Forest Inventory (NFI13, 2019–2023). “No damage NFI13” denotes stands with no recorded moose damage in either NFI10 or NFI13. Boxes indicate the interquartile range, whiskers the range, dashed horizontal lines the mean, and solid lines within boxes the median.
| Table 3. Mean number of seedlings in seedling stands artificially regenerated for Scots pine in the 10th National Forest Inventory (NFI10, 2004–2008), measured in NFI10 and remeasured in the 13th National Forest Inventory (NFI13, 2019–2023), classified by moose damage severity recorded in NFI10 and vegetation zone in Finland. | |||||
| Young seedling stands in NFI10 | |||||
| Vegetation zone | Damage severity in NFI10 | Number of seedlings in NFI10, pcs ha–1 | Number of seedlings in NFI13, pcs ha–1 | ||
| Crop seedlings | All seedlings | Crop seedlings | All seedlings | ||
| Southern | Mild | 2296 | 14 913 | - | - |
| Notable | 2530 | 10 381 | 2200 | 2700 | |
| Severe | 2028 | 10 094 | - | - | |
| No damage | 2165 | 9919 | 1914 | 5648 | |
| Middle | Mild | 2688 | 21 682 | 2031 | 5181 |
| Notable | 1891 | 13 625 | 1593 | 8314 | |
| Severe | 1000 | 2000 | 1150 | 1250 | |
| No damage | 2407 | 11 695 | 1967 | 5596 | |
| Northern | Mild | 2850 | 5500 | 1550 | 1550 |
| Notable | 2050 | 6000 | 1650 | 2500 | |
| Severe | - | - | - | - | |
| No damage | 2439 | 7496 | 2070 | 5588 | |
| Advanced seedling stand in NFI10 | |||||
| Southern | Mild | 1952 | 9144 | - | - |
| Notable | 2078 | 10 292 | - | - | |
| Severe | 1622 | 11 282 | - | - | |
| No damage | 2156 | 10 227 | 2535 | 10 219 | |
| Middle | Mild | 2141 | 8475 | - | - |
| Notable | 1974 | 8750 | 2019 | 3675 | |
| Severe | 1616 | 6419 | - | - | |
| No damage | 2124 | 7460 | 2051 | 5172 | |
| Northern | Mild | 2175 | 6750 | - | - |
| Notable | 1733 | 15 333 | - | - | |
| Severe | 1000 | 2500 | - | - | |
| No damage | 1678 | 5746 | - | - | |
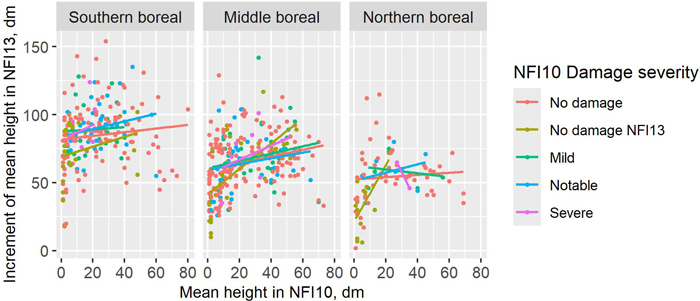
Fig. 8. Increment of mean height of the growing stock between the 10th National Forest Inventory (NFI10, 2004–2008) and the 13th National Forest Inventory (NFI13, 2019–2023) in seedling stands artificially regenerated for Scots pine, classified by moose damage severity in NFI10 and vegetation zone in Finland. “No damage NFI13” denotes stands with no moose damage in either NFI10 or NFI13. Lines represent linear regression fits.
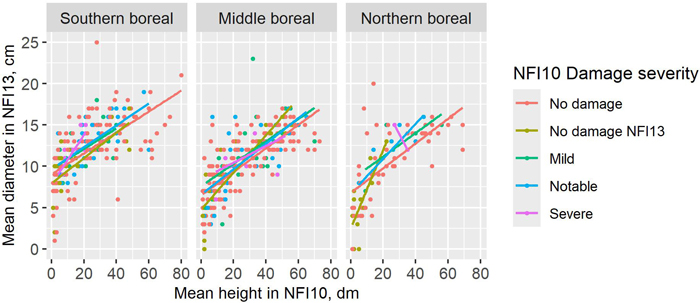
Fig. 9. Mean diameter of seedling stands, artificially regenerated for Scots pine, by damage severity class in the 10th National Forest Inventory (NFI10) and vegetation zone in Finland, measured in NFI10 (2004–2008) and remeasured in the 13th National Forest Inventory (NFI13, 2019–2023). “No damage NFI13” denotes stands with no recorded moose damage in either NFI10 or NFI13. Lines represent linear regression fits.
| Table 4. Mean height and diameter of seedling stands artificially regenerated for Scots pine in the 10th National Forest Inventory (NFI10, 2004–2008), measured in NFI10 and remeasured in the 13th National Forest Inventory (NFI13, 2019–2023), classified by moose damage severity in NFI10, the occurrence of moose damage in NFI13, and vegetation zone in Finland. NFI13 = 0 indicates that no moose damage was recorded in NFI13, whereas NFI13 = 1 indicates that moose damage was recorded in NFI13. | |||||||
| Young seedling stand in NFI10 | |||||||
| Vegetation zone | Damage severity in NFI10 | Mean height in NFI10, dm | Mean height in NFI13, dm | Mean diameter in NFI13, cm | |||
| NFI13 = 0 | NFI13 = 1 | NFI13 = 0 | NFI13 = 1 | NFI13 = 0 | NFI13 = 1 | ||
| Southern | Mild | 8.2 | 7.2 | 99.3 | 85.8 | 10.1 | 11.6 |
| Notable | 7.8 | 7.0 | 87.1 | 88.0 | 9.6 | 11.0 | |
| Severe | 6.0 | 10.5 | 93.1 | 92.5 | 9.1 | 12.0 | |
| No damage | 4.9 | 3.9 | 81.1 | 73.2 | 8.8 | 8.4 | |
| Middle | Mild | 8.7 | 11.7 | 58.9 | 81.3 | 7.0 | 10.0 |
| Notable | 7.7 | 5.5 | 58.1 | 68.3 | 5.9 | 9.1 | |
| Severe | 9.0 | - | 44.0 | - | 6.0 | - | |
| No damage | 5.9 | 5.5 | 65.7 | 51.4 | 7.1 | 5.9 | |
| Northern | Mild | 11.0 | - | 63.0 | - | 8.0 | - |
| Notable | 7.0 | 5.0 | 42.0 | 60.0 | 5.0 | 8.0 | |
| Severe | - | - | - | - | - | - | |
| No damage | 5.1 | 5.1 | 48.8 | 37.1 | 6.3 | 5.1 | |
| Advanced seedling stand in NFI10 | |||||||
| Southern | Mild | 31.4 | 24.0 | 122.3 | 109.0 | 13.8 | 12.1 |
| Notable | 28.2 | 33.4 | 119.8 | 133.3 | 13.3 | 15.1 | |
| Severe | 18.8 | 17.9 | 125.2 | 104.8 | 13.8 | 12.8 | |
| No damage | 36.1 | 36.7 | 124.9 | 117.6 | 13.9 | 13.3 | |
| Middle | Mild | 36.8 | 32.2 | 107.8 | 104.4 | 13.0 | 12.0 |
| Notable | 37.3 | 25.7 | 108.8 | 91.3 | 12.7 | 10.5 | |
| Severe | 29.9 | 22.0 | 103.6 | 89.0 | 11.5 | 13.0 | |
| No damage | 36.3 | 36.2 | 105.4 | 115.6 | 11.9 | 13.3 | |
| Northern | Mild | 35.0 | - | 97.0 | - | 14.3 | - |
| Notable | 33.2 | 14.0 | 95.8 | 80.0 | 13.8 | 12.0 | |
| Severe | 31.0 | - | 86.5 | - | 13.5 | - | |
| No damage | 36.4 | 22.0 | 94.9 | 94.0 | 12.9 | 13.0 | |