| Table 1. Location and key characteristics of the four research sites in Eastern Finland where the nitrogen (N) fertilization experiments were conducted. The mean annual air temperature and precipitation are shown as 30-year averages from 1990–2020 (Finnish Meteorological Institute, 2023). Table adapted from Jetsonen et al. (2024). | ||||
| Location/key characteristic | Liperi | Ilomantsi | Juuka | Savonranta |
| Latitude | 62,55846 N | 62,85543 N | 63,066199 N | 62,139028 N |
| Longitude | 29,06265 E | 30,67705 E | 28,874640 E | 29,149086 E |
| Altitude (m a.s.l.) | 160 | 180 | 170–200 | 120–140 |
| Dominant tree species | Pinus sylvestris | Pinus sylvestris | Picea abies | Picea abies |
| Mean annual air temperature (°C) | 3.5 | 3.0 | 2.8 | 3.4 |
| Effective temperature sum (d.d.) | 1200–1300 | 1100–1200 | 1100–1200 | 1200–1300 |
| Annual precipitation (mm) | 640 | 644 | 661 | 670 |
| Date of N application | 27/06/2018 | 20/07/2020 | 25–27/07/2019 | 10/08/2101 |
| Means of application | Forwarder | Forwarder | Helicopter | Helicopter |
| Range of the realised N fertilizer dose (kg N ha–1) (> 0 in plots*) | 110–288 | 109–369 | 48–441 | 50–426 |
| Stand density (stems ha–1) | 513 | 687 | 619 | 455 |
| Mean diameter at breast height (cm) | 23 | 18 | 21 | 21 |
| Initial volume (m3 ha–1) | 167 | 170 | 187 | 159 |
| *In one plot at Ilomantsi and two plots at Savonranta that were intended to be fertilized, the amount of funnel-trap-observed fertilizer was zero due to problems with the fertilization procedure, and so these values were excluded from the range values. | ||||
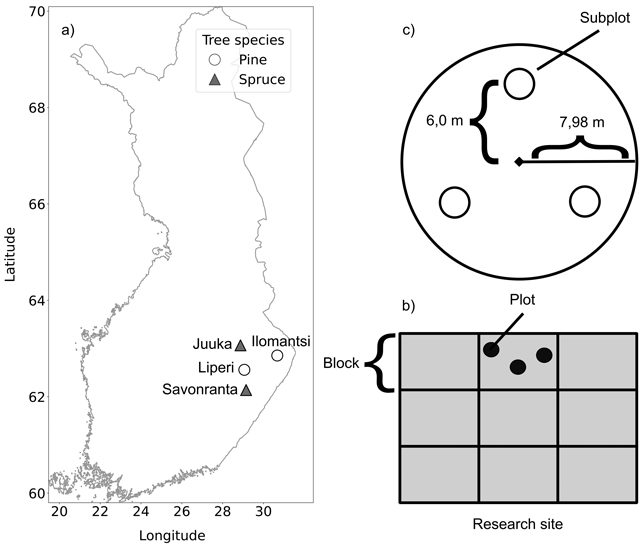
Fig. 1. Location of the study sites and the experimental setup. The circles in (a) represent the Scots pine-dominated research sites and the triangles the Norway spruce-dominated research sites. Each research site (b) had three blocks (of 1 ha) per treatment (0, 150 and 200 kg N ha–1), giving nine blocks in total. Each block contained three circular plots (200 m2) from which the fertilization evenness and tree attributes were derived. Each plot (c) contained three smaller subplots (0.5 m2) for determining the ground vegetation cover and species composition.
| Table 2. Ground vegetation species represented in the different vascular plant and bryophyte species groups under the Scots pine and Norway spruce stands. | |
| Tree species / ground vegetation group | Ground vegetation / vascular plant and bryophyte species |
| Pine stands / Grasses | Agrostis sp., Calamagrostis arundinacea, Calamagrostis phragmitoides, Deschampsia flexuosa, Poa nemoralis |
| Pine stands / Herbs | Athyrium filix-femina (L.) Roth, Carex brunnescens, Carex digitata, Carex globularis, Carex ovalis L., Convallaria majalis, Dryopteris carthusiana, Epilobium angustifolium L., Equisetum sylvaticum L., Fragaria vesca, Goodyera repens (L.) R. Br., Gymnocarpium dryopteris, Hierachium sp., Juncus effusus, Luzula pilosa, Lycopodium clavatum L., Maianthemum bifolium, Melampyrum pratense, Orthilia secunda, Oxalis acetosella., Potentilla erecta, Pteridium aquilinum, Rubus idaeus L., Rubus saxatilis L., Solidago virgaurea, Stellaria media, Trientalis europaea L., Veronica officinalis, Viola palustris L. |
| Pine stands / Shrubs | Calluna vulgaris (L.) Hull, Linnaea borealis, Salix sp., Vaccinium myrtillus L., Vaccinium vitis-idaea |
| Pine stands / Byophytes | Aulacomnium palustre, Brachythecium sp., Bryum sp., Dicranum sp., Hylocomium splendens, Marchantiophyta sp., Pleurozium schreberi, Pohlia nutans, Polytrichum sp., Ptilium crista-castrensis, Rhodobryum roseum (Hedw.) Limpr., Sphagnum sp. |
| Spruce stands / Grasses | Agrostis sp., C. arundinacea, Calamagrostis phragmitoides Hartm. Calamagrostis sp., D. flexuosa, Melica nutans L., P. nemoralis |
| Spruce stands / Herbs | Angelica sylvestris L., C. brunnescens, C. digitata, C. globularis, Carex sp., C. majalis, D. carthusiana, E. angustifolium, F. vesca, G. repens, G. dryopteris, Hieracium sp., Lathyrus pratensis L., L. pilosa, M. bifolium, M. pratense, Melampyrum sylvaticum L., O. acetosella, O. secunda, Platanthera bifolia (L.) Rich., P. aquilinum, Pyrola minor L., R. idaeus, R. saxatilis, S. virgaurea, T. europea, Viola canina L., Viola riviniana Rchb., Viola sp. |
| Spruce stands / Shrubs | C. vulgaris, L borealis, V. myrtillus, V. vitis-idaea |
| Spruce stands / Bryophytes | A. palustre, Brachythecium sp., Bryum sp., Dicranum sp., H. splendens, Marchantiophyta sp., Plagiomnium cuspidatum (Hedw.) T.J. Kop., P. schreberi, P. nutans, Polytrichum sp., P. crista-castrensis., R. roseum, Rhytidiadelphus triquetrus, Sphagnum sp. |
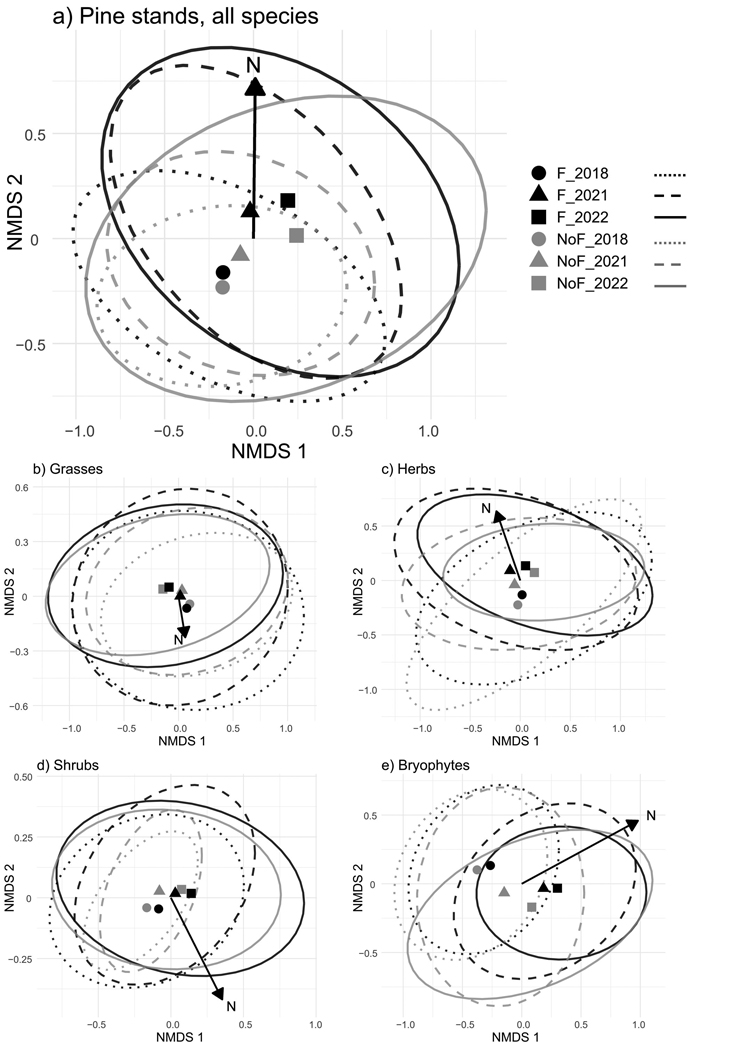
Fig. 2. Non-metric multidimensional scaling (NMDS) for (a) all, (b) grass, (c) herb, (d) shrub and (e) bryophyte species in the Scots pine stands. Instead of showing each observation as a separate point, the figure shows centroids (the mean value) of all observations in each group, and envelopes (the ellipses) that represent the region of all observations around each centroid. The centroids and envelopes are shown separately for all the observations from the fertilized (F) and unfertilized (NoF) subplots for each year (2018 with solid circles and dotted lines, 2021 with triangles and dashed lines, and 2022 with squares and solid lines). The axes display the main dimensions of relative dissimilarity of the data, so that the closer the observations are to each other the more similar they are. The funnel trap-based fertilizer dose (N) is marked with a black arrow that shows the direction of increasing fertilizer dose in the ordination space.
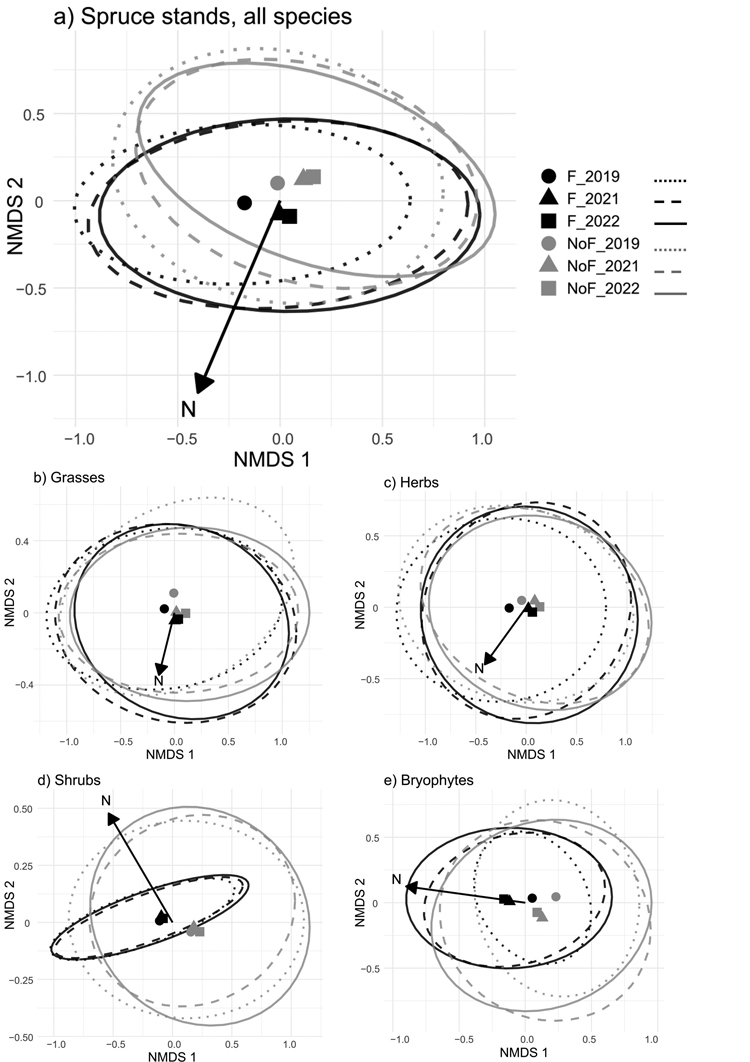
Fig. 3. Non-metric multidimensional scaling (NMDS) for (a) all, (b) grass, (c) herb, (d) shrub and (e) bryophyte species in the Norway spruce stands. Instead of showing each observation as a separate point, the figure shows centroids (the mean value) of all observations in each group, and envelopes (the ellipses) that represent the region of all observations around each centroid. The centroids and envelopes are shown separately for all the observations from the fertilized (F) and unfertilized (NoF) subplots for each year (2019 with solid circles and dotted lines, 2021 with triangles and dashed lines, and 2022 with squares and solid lines). The axes display the main dimensions of relative dissimilarity of the data, so that the closer the observations are to each other the more similar they are. The funnel trap-based fertilizer dose (N) is marked with a black arrow that shows the direction of increasing fertilizer dose in the ordination space.