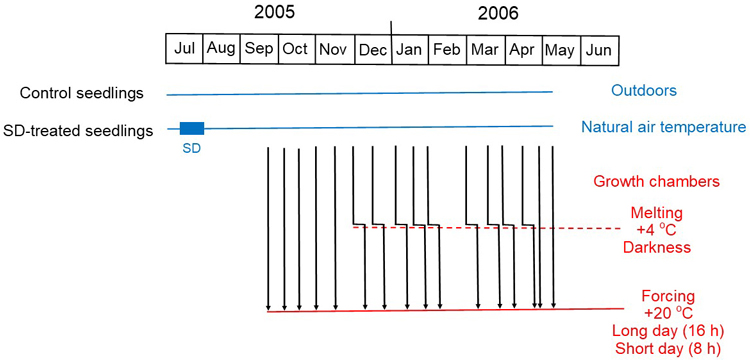
Fig. 1. Experimental design of the study. In the summer of 2005, the experimental Norway spruce seedlings were divided into two groups: half of the seedlings were kept all the time in natural conditions outdoors (Control seedlings), whereas the other half was exposed outdoors with black curtains to a short-day (12 h) treatment from 11 July to 1 August (SD-treated seedlings). The short-day treatment is indicated by the blue box on the left-hand side of the figure. During the next overwintering period seedlings from both groups were transferred on 16 occasions from outdoors to forcing conditions in growth chambers (vertical arrows, for the exact dates, see Table 1), thus exposing the seedlings in the different transfers to different durations of natural chilling. Forcing took place both under long-day (16 h) and short-day (8 h) conditions, air temperature was +20 °C in both. In the forcing conditions the occurrence (bud burst percentage, BB%) and timing (days to bud burst, DBB) of bud burst was examined. The explaining factors were the short-day treatment in the preceding summer, transfer time from the chilling conditions to the forcing conditions, and the day length in the forcing conditions. In nine transfers in the winter the seedlings were frozen, so before transferring them to the forcing conditions they were carefully melted for one week in darkness under +4 °C (angular arrows in the middle of the figure). In the analysis of the results the one week under +4 °C was considered as chilling, so that the time of the second transfer, i.e., the transfer from +4 °C to the forcing conditions, was used as the transfer time.
| Table 1. Dates when the seedlings were transferred in 2005–2006 to a regrowth test under forcing conditions in a greenhouse, either directly from natural outdoor conditions or after cautious melting in preforcing conditions at +4 °C. The transfers in which cautious melting was used are indicated in bold. | ||
| Transfer number | Transfer from outdoors | Transfer to forcing |
| 1 | 20 September | 20 September |
| 2 | 4 October | 4 October |
| 3 | 18 October | 18 October |
| 4 | 1 November | 1 November |
| 5 | 15 November | 15 November |
| 6 | 29 November | 6 December |
| 7 | 13 December | 20 December |
| 8 | 3 January | 10 January |
| 9 | 17 January | 24 January |
| 10 | 31 January | 7 February |
| 11 | 28 February | 7 March |
| 12 | 14 March | 21 March |
| 13 | 28 March | 4 April |
| 14 | 11 April | 18 April |
| 15 | 25 April | 25 April |
| 16 | 9 May | 9 May |
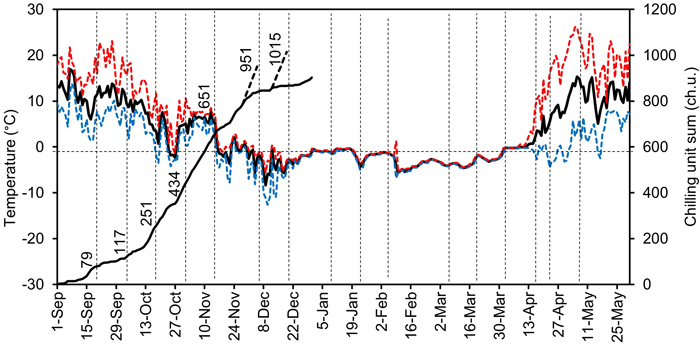
Fig. 2. The daily minimum (blue curve), mean (black curve), and maximum (red curve) outdoor air temperatures from autumn 2005 to spring 2006 (fluctuating curves), and the daily chilling unit sum accumulation (solid black ascending curve on the left) in the experiment carried out at Punkaharju, Finland (61°48´N, 29°20´E). The temperature was measured hourly in the outdoor chilling conditions at the seedling shoot level. The transfer times from the outdoor natural chilling conditions or from the preforcing conditions (+4 °C) applied to melt the seedlings frozen in winter to the forcing conditions in the greenhouse are shown by dashed vertical lines. The figures attached to the curves on the left-hand side of the figure indicate the corresponding chilling unit sum accumulated by each transfer before the end of the year. The chilling unit accumulations in the preforcing conditions are shown by the black dashed ascending curves. The dashed horizontal line indicates the temperature of 0 °C and the chilling unit sum of 600 ch.u.
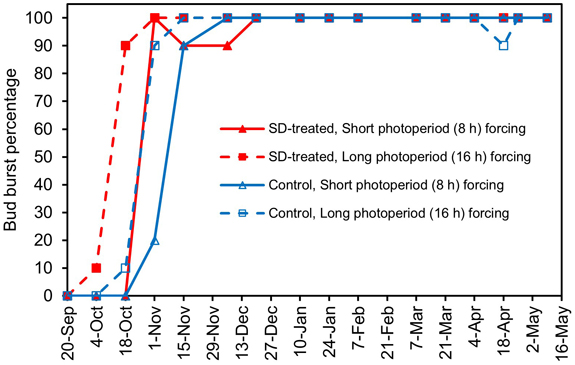
Fig. 3. Bud burst percentage, BB%, of the terminal buds in second-year SD-treated seedlings (SD, red lines and solid red symbols) and control seedlings (blue lines and empty blue symbols) of Norway spruce in a chilling-forcing experiment carried out with day lengths of 8 h (triangles, solid lines) and 16 h (squares, dashed lines) in the forcing conditions. The SD treatment was performed in late summer 2005, and after that, the seedlings were chilled in outdoor natural conditions. The horizontal axis indicates the dates when the seedlings were transferred from outdoor natural chilling conditions (or from the preforcing conditions at +4 °C) to a regrowth test under forcing conditions in a greenhouse (see Table 1, Figs. 1 and 2). The standard error of the mean BB% varied between 0.0 and 12.6%.
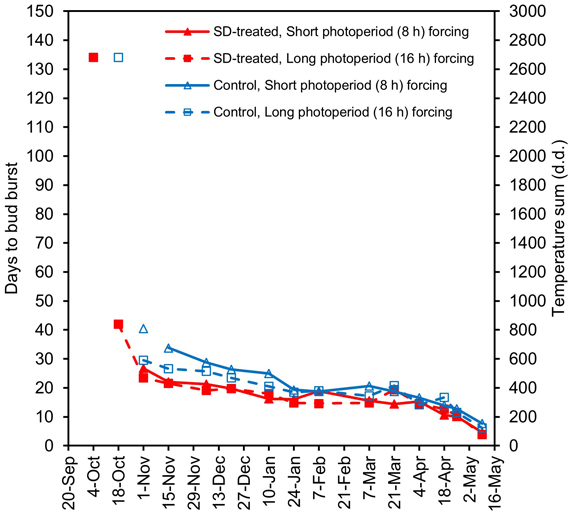
Fig. 4. Mean days to bud burst, DBB, from the beginning of forcing in second-year SD-treated seedlings (SD, red lines and solid red symbols) and control seedlings (blue lines and empty blue symbols) of Norway spruce in a chilling-forcing experiment carried out with day lengths of 8 h (triangles, solid lines) and 16 h (squares, dashed lines) in the forcing conditions. The SD treatment was performed in late summer 2005, and after that, the seedlings were chilled in outdoor natural conditions. The horizontal axis indicates the dates when the seedlings were transferred from outdoor natural chilling conditions (or from the preforcing conditions at +4 °C) to a regrowth test under forcing conditions in a greenhouse (Table 1, Figs. 1 and 2). The vertical axis on the right-hand side of the figure shows the approximate temperature sum with the threshold temperature of 0 °C in forcing conditions corresponding to the DBB. The standard error of the mean DBB varied between 1.5 and 4.8 days. The data points not connected with the corresponding line indicate observations based on low numbers (1–2) of seedlings showing bud burst.
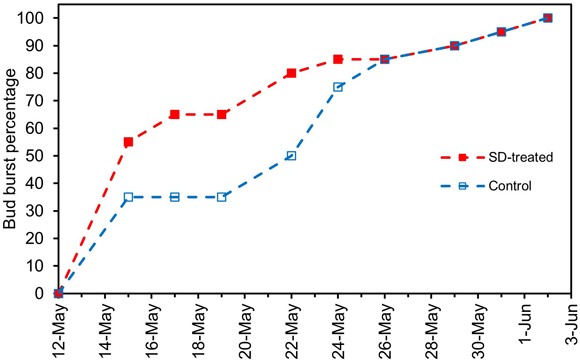
Fig. 5. Development of the bud burst percentage, BB%, of the terminal buds in SD-treated seedlings (SD, red lines and solid red symbols) and control seedlings (blue lines and empty blue symbols) of Norway spruce under natural outdoor conditions in spring 2006. The SD treatment was performed in late summer 2005.