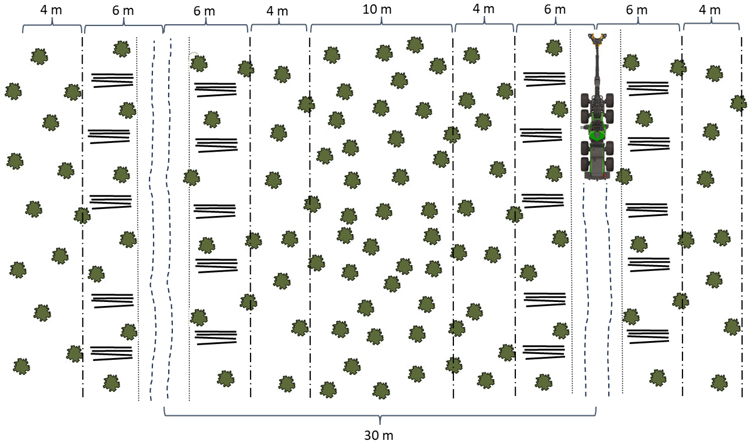
Fig. 1. The schematic picture showing the first thinning according to the zone thinning method. The strip roads are 30 m apart, with a 10-m-wide unharvested zone between them. The zones parallel to the strip roads have varying intensity of thinning. In the second thinning, the strip roads are opened into the unharvested zone, and the stand is thinned to create a uniform density throughout the stand area. Source: Ovaskainen et al. (2024).
| Table 1. Workflow of establishing experiments, collecting data and conducting simulations in the study stands in Central and Eastern Finland. | |
| Stands 1 and 2 in Central Finland | Stands 3 and 4 in Eastern Finland |
| 1. Selecting stands for thinning treatments. 2. Allocating the treatments within stands. 3. Cutting and recording the hpr files. 4. Locating plots within stands and measuring the remaining trees on the plots. 5. Calculating the plot-wise removal using plot locations and the hpr files. 6. Calculating the stand characteristics and harvested removals for each plot. 7. Running simulations using the remaining trees as initial stand states. | 1. Selecting stands for thinning treatments. 2. Locating the plots within the stands. 3. Allocating the treatments for the plots. 4. Cutting and recording the hpr file for each plot. 5. Measuring the remaining trees on the plots. 6. Calculating plot-wise removal using hpr files. 7. Calculating stand characteristics and harvested removals for each plot. 8. Running simulations using the remaining trees as initial stand states. |
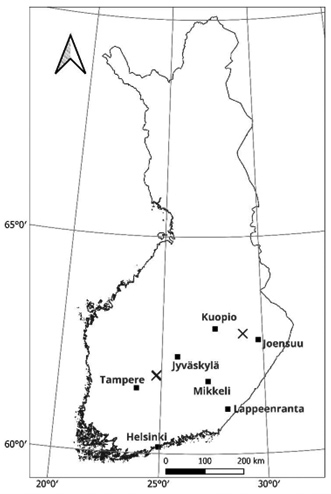
Fig. 2. Locations of the spruce-dominated stands (×) used to study the zone and low thinning treatments in Central and Eastern Finland.
| Table 2. Number of plots measured in Stands 1–4 located in Central (1 and 2) and Eastern Finland (3 and 4) and stand age according to UPM-Kymmene’s forest resources data. In total, 30 plots were included in the study: 18 zone-thinned plots and 12 low-thinned plots. | ||||||||
| Stand | Location | Stand age (years) | Number of plots | Second thinning** | Time since final cutting (years) | |||
| Zone thinning* | Low thinning | Total | Time since (years) | Thinning intensity (%) | ||||
| 1 | Jämsä (61°48´N, 24°46´E) | 37 | 4 | 2 | 6 | 10–15 / 15 | 24–34 / 17–25 | 30 |
| 2 | Orivesi (61°47´N, 24°44´E) | 33 | 2 | 1 | 3 | 15 / 10 | 29 / 31 | 30 |
| 3 | Outokumpu (62°46´N, 29°01´E) | 63 | 6 | 4 | 10 | 10–15 / 10–15 | 33–46 / 28–35 | 25 |
| 4 | Outokumpu (62°45´N, 29°00´E) | 68 | 6 | 5 | 11 | 10–15 / 15–20 | 27–38 / 21–24 | 35 |
| * On the zone thinning plots of Stands 1–3, trees were removed using thinning from below, whereas in Stand 4, both large and small trees were removed. ** Time since and intensity in second thinning are given separately for zone- and low-thinned plots. Three low-thinned plots in Stand 4 had no second thinning before clearcutting. | ||||||||
| Table 3. Means and standard deviations (SD) of post-thinning stand characteristics for all trees taller than 1.3 m on zone- and low-thinned plots in spruce-dominated stands in Central and Eastern Finland. Dbh = diameter at breast height (1.3 m). Treatment data for the same location marked with different letters are significantly different (p < 0.05) according to the two-way ANOVA with stand and treatment and their interaction as factors and post hoc LSD tests based on estimated marginal means. | |||||||||||||||||
| Thinning treatment | No. of plots | No. of stems (ha−1) | Stand basal area (m2 ha−1) | Stand volume (m3 ha−1) | Mean dbh, basal area-weighted (cm) | Mean height, basal area-weighted (m) | Proportion of spruce in volume (%) | Pre-thinning stand volume * (m3 ha−1) | Harvesting damage ** (%) | ||||||||
| Mean | SD | Mean | SD | Mean | SD | Mean | SD | Mean | SD | Mean | SD | Mean | SD | Mean | SD | ||
| Stands 1 and 2 in Central Finland | |||||||||||||||||
| Zone | 6 | 1233a | 272 | 16.0 | 3.7 | 100.1 | 26.7 | 14.9 | 1.4 | 13.3 | 1.3 | 76.5 | 11.5 | 133.4 | 43.5 | 0.7 | 1.3 |
| Low | 3 | 900b | 153 | 14.2 | 4.6 | 95.2 | 45.8 | 16.0 | 3.3 | 14.0 | 2.3 | 89.9 | 7.0 | 155.9 | 89.5 | 3.8 | 3.9 |
| Stands 3 and 4 in Eastern Finland | |||||||||||||||||
| Zone | 12 | 1332 | 604 | 21.8a | 3.4 | 160.1a | 40.2 | 19.7 | 3.5 | 18.7 | 3.5 | 53.4a | 13.3 | 334.9a | 99.1 | 5.8 | 3.2 |
| Low | 9 | 1265 | 314 | 17.2b | 4.6 | 123.1b | 43.4 | 18.9 | 3.3 | 17.7 | 3.6 | 34.3b | 13.4 | 249.8b | 58.6 | 3.2 | 3.8 |
| * Pre-thinning stand volume was calculated as the sum of the merchantable volume of the remaining trees and the volume harvested. ** Proportion of remaining trees with dbh > 70 mm that were damaged in thinning. | |||||||||||||||||
| Table 4. Estimated marginal means (EMM) and standard errors (SE) of the harvested and simulated removals on zone- and low-thinned plots in spruce-dominated stands in Central and Eastern Finland. Treatment data marked with different letters are significantly different (p < 0.05) according to the two-way ANOVA with stand and treatment and their interaction as factors and pre-thinning stand volume as covariate (150 m3 ha−1 for Stands 1 and 2, and 300 m3 ha−1 for Stands 3 and 4), and post hoc LSD tests based on EMMs. | |||||||||||||||||||
| Thinning treatment | No. of plots | Harvested removal in zone or low thinning | Simulated removal in the subsequent thinning and clearcutting | Harvested and simulated removal in total | |||||||||||||||
| Sawlog (m3 ha−1) | Pulpwood (m3 ha−1) | Total (m3 ha−1) | Sawlog (m3 ha−1) | Pulpwood (m3 ha−1) | Total (m3 ha−1) | Sawlog (m3 ha−1) | Pulpwood (m3 ha−1) | Total (m3 ha−1) | |||||||||||
| EMM | SE | EMM | SE | EMM | SE | EMM | SE | EMM | SE | EMM | SE | EMM | SE | EMM | SE | EMM | SE | ||
| Stands 1 and 2 in Central Finland | |||||||||||||||||||
| Zone | 6 | --* | -- | 39.7a | 2.2 | 39.7a | 2.2 | 264.4 | 8.4 | 120.9a | 6.1 | 385.3 | 12.4 | 264.4 | 8.4 | 160.6 | 4.6 | 425.0 | 10.2 |
| Low | 3 | --* | -- | 61.4b | 3.2 | 61.4b | 3.2 | 255.2 | 12.2 | 79.6b | 8.8 | 334.8 | 18.0 | 255.2 | 12.2 | 141.0 | 6.6 | 396.2 | 14.7 |
| Stands 3 and 4 in Eastern Finland | |||||||||||||||||||
| Zone | 12 | 70.8 | 5.4 | 90.8a | 4.7 | 161.6 | 6.1 | 238.5 | 11.0 | 99.3a | 3.9 | 337.7 | 10.4 | 309.3 | 9.2 | 190.1 | 5.4 | 499.3 | 5.1 |
| Low | 9 | 50.8 | 6.5 | 108.5b | 5.6 | 159.2 | 7.3 | 265.8 | 13.2 | 79.7b | 4.7 | 345.6 | 12.5 | 316.6 | 11.0 | 188.2 | 6.5 | 504.8 | 6.2 |
| * All wood harvested in the first thinning was classified as pulpwood in Stands 1 and 2. | |||||||||||||||||||
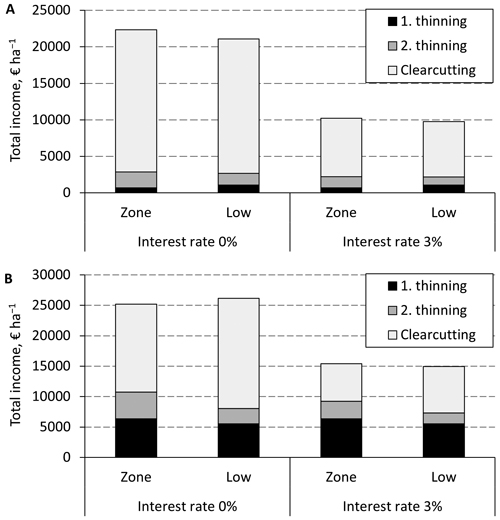
Fig. 3. Estimated marginal means of the total income (€ ha–1) from thinnings and clearcutting in Stands 1 and 2 in Central Finland (A) and in Stands 3 and 4 in Eastern Finland (B). The net present value of incomes, using an interest rate of 0% and 3%, is determined at the time of the first thinning treatment, performed using either zone or low thinning. Treatment had no significant (p > 0.05) effect based on the two-way ANOVA.