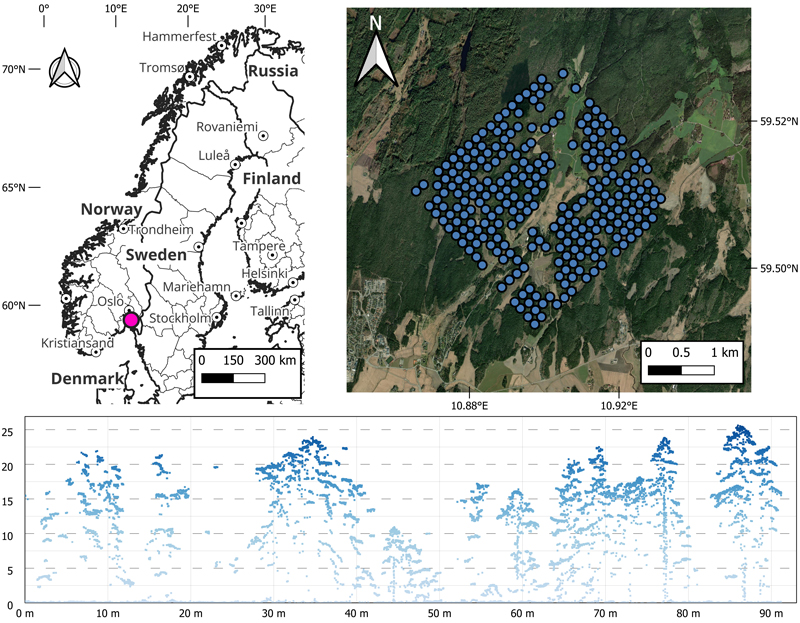
Fig. 1. The location of our study area in pink (Våler municipality) in Norway (top left; made with Natural Earth), a zoomed in view of the 253 plot locations in blue (top right; made with Esri World Imagery), and a circular cross-section of the point cloud obtained from near the perimeter of a single plot coloured by height (bottom; made with own data).
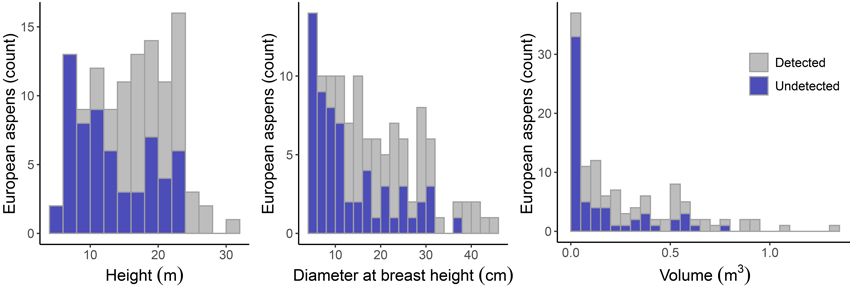
Fig. 2. The number of detected and undetected field-measured European aspens by height (left), diameter at breast height (centre), and volume (right) from our study area in Våler, Norway.
| Table 1. Definitions of the binary classification measures used in this work. The Bayesian estimate of FDRtree (base rate p) is defined using the expected value and estimated by the mean of the distribution obtained directly by simulating samples from the false discovery rate and true positive rate distributions. Note that Cohen’s Kappa is primarily included for illustrative purposes, although its use in low prevalence classification is discouraged (Foody 2020). | ||
| Primary metrics | Frequentist approach | Bayesian approach (Jeffreys prior) |
| FNRtree | ||
| FNRvolume | ||
| FPRtree | ||
| TPRtree | ||
| FDRtree (sample) | ||
| FDRvolume (sample) | ||
| FDRtree (base rate p) | ||
| Secondary metrics | ||
| F1-score | ||
| User’s accuracy | ||
| Producer’s accuracy | ||
| Overall accuracy | ||
| Cohen’s Kappa | ||
| Matthews correlation coefficient | ||
| FDR = False discovery rate, FN = False negative, FNR = False negative rate, FP = False positive, TN = True negative, TP = True positive, and TPR = True positive rate. | ||


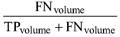


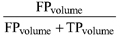
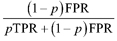
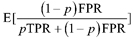

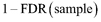

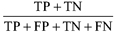


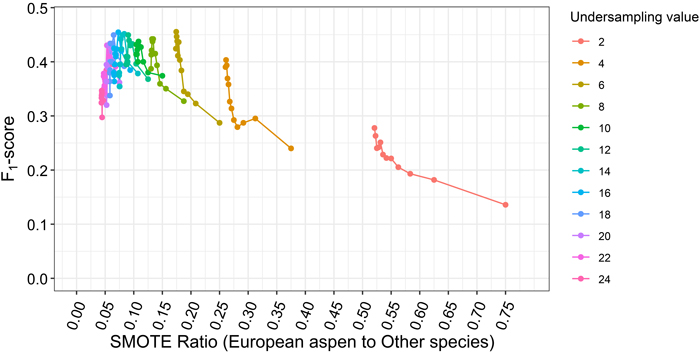
Fig. 3. The effect of different ratios of European aspen to other tree species from our study area in Våler, Norway resulting from synthetic minority oversampling technique (SMOTE) with various degrees of over- and undersampling on the F1-score of European aspens. The over- and undersampling values in this figure ranged from 2 to 24 in steps of 2 (following criteria from the R package performanceEstimation). Oversampling values go from 2 to 24 from right to left for each undersampling value.
| Table 2. Tree-level confusion matrices from random forest with five-fold plot-level cross-validation for all segmented trees and only canopy-reaching trees (trees within four meters from the highest laser echo in each plot). We show count-based and volume-based results (in m3) with 95% posterior credible intervals in parentheses. Results from our study area in Våler, Norway. | |||||
| All trees (count-based) | |||||
| Predicted class | |||||
| European aspen | Other | Sum | FNR | ||
| Observed class | European aspen | 15 | 40 | 55 | 73% (60–83) |
| Other | 7 | 5393 | 5400 | ||
| Sum | 22 | 5433 | |||
| FDR | 32% (16–52) | ||||
| All trees (volume-based) | |||||
| Predicted class | |||||
| European aspen | Other | Sum | FNR | ||
| Observed class | European aspen | 9.5 | 11.1 | 20.6 | 54% (38–71) |
| Other | 4.3 | 1613.6 | 1617.9 | ||
| Sum | 13.8 | 1624.7 | |||
| FDR | 31% (11–51) | ||||
| Canopy-reaching trees (count-based) | |||||
| Predicted class | |||||
| European aspen | Other | Sum | FNR | ||
| Observed class | European aspen | 11 | 20 | 31 | 65% (47–79) |
| Other | 3 | 1973 | 1976 | ||
| Sum | 14 | 1993 | |||
| FDR | 21% (7–46) | ||||
| Canopy-reaching trees (volume-based) | |||||
| Predicted class | |||||
| European aspen | Other | Sum | FNR | ||
| Observed class | European aspen | 7.0 | 8.5 | 15.5 | 55% (35–75) |
| Other | 1.7 | 1048.2 | 1049.9 | ||
| Sum | 8.7 | 1056.7 | |||
| FDR | 20% (0–43) | ||||
| FDR = False discovery rate, FNR = False negative rate. | |||||
| Table 3. Several standard metrics shown from random forest with five-fold plot-level cross-validation for all segmented trees and only canopy-reaching trees (trees within four meters from the highest laser echo in each plot) with count-based and volume-based results from our study area in Våler, Norway. | ||||||
| F1-score European aspen | User’s accuracy European aspen | Producer’s accuracy European aspen | Overall accuracy | Cohen’s Kappa | Matthews correlation coefficient | |
| All trees (count-based) | 0.39 | 0.68 | 0.27 | 0.99 | 0.39 | 0.43 |
| All trees (volume-based) | 0.55 | 0.69 | 0.46 | 0.99 | 0.55 | 0.56 |
| Canopy-reaching trees (count-based) | 0.49 | 0.79 | 0.35 | 0.99 | 0.48 | 0.52 |
| Canopy-reaching trees (volume-based) | 0.58 | 0.80 | 0.45 | 0.99 | 0.57 | 0.60 |
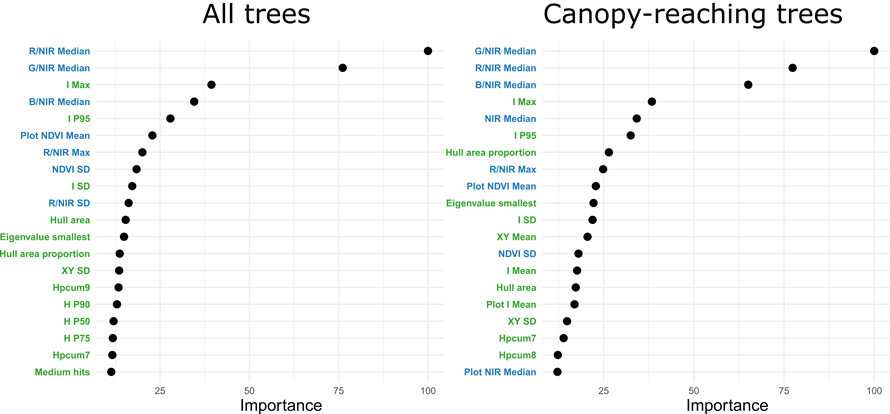
Fig. 4. Variable-importance measures for the 20 best features to separate European aspen from non-aspen species for all trees and only canopy-reaching trees from our study area in Våler, Norway. A green font colour represents ALS-derived features, while a blue font colour represents spectral features. Abbreviations: / = division of two image bands, R = Red, G = Green, B = Blue, NIR = near-infrared, NDVI = normalised difference vegetation index, I = intensity, H = height, P = percentile, SD = standard deviation, XY = XY-plane, f = first and only echoes, pcum = cumulative percentage of returns in the xth layer.
| Table 4. Re-analysis of ten previous publications on tree species classification from remotely sensed data in Fennoscandia where European aspen was included as a class. For comparison, our count-based results from this study are displayed in red but not included in the median and mean calculations. Assuming a 1% base rate (meaning that European aspen represents 1% of all tree species in an area), we display the false negative and false discovery rates (the latter being strongly affected by the selected base rate) of these publications and our results in this study with their 95% posterior credible intervals in parentheses. | ||||||
| Author(s) | N other | N European aspen | European aspen (%) | FNR | FDR (sample) | FDR (1% BR) |
| Erikson 2004 | 777 | 14 | 1.8% | 30% (10–55) | 38% | 52% (31–72) |
| Kulikova et al. 2007 | 34 | 14 | 29% | 17% (3–39) | 14% | 86% (59–96) |
| Ørka et al. 2007 | 203 | 21 | 9% | 75% (55–90) | 44% | 88% (70–97) |
| Viinikka et al. 2020 | 528 | 178 | 25% | 11% (7–16) | 8% | 73% (61–82) |
| Mäyrä et al. 2021 | 448 | 82 | 15% | 13% (6–21) | 6% | 56% (33–73) |
| Kuzmin et al. 2021 | 63 | 28 | 31% | 19% (7–35) | 15% | 88% (73–95) |
| Hardenbol et al. 2021 | 383 | 104 | 21% | 4% (1–9) | 3% | 45% (19–68) |
| Korpela et al. 2022 | 2405 | 167 | 6% | 23% (17–30) | 16% | 57% (47–66) |
| Bjørnbet 2024 | 431 | 48 | 10% | 62% (48–75) | 50% | 91% (86–95) |
| Toivonen et al. 2024 | 33 164 | 31 | 0.1% | 77% (61–89) | 80% | 28% (16–46) |
| Median | 439 | 39 | 8% | 21% | 16% | 65% |
| Mean | 3844 | 69 | 18% | 33% | 27% | 66% |
| This work (all trees) | 5400 | 55 | 1% | 72% (60–83) | 32% | 33% (16–52) |
| This work (canopy-reaching trees) | 1976 | 31 | 1.5% | 65% (47–79) | 21% | 32% (10–57) |
| ALS = Airborne laser scanning, BR = Base rate, CIR = Colour-infrared, FDR = False discovery rate, FNR = False negative rate, HS = Hyperspectral imagery, MS = Multispectral imagery, RS = Remote sensing. | ||||||