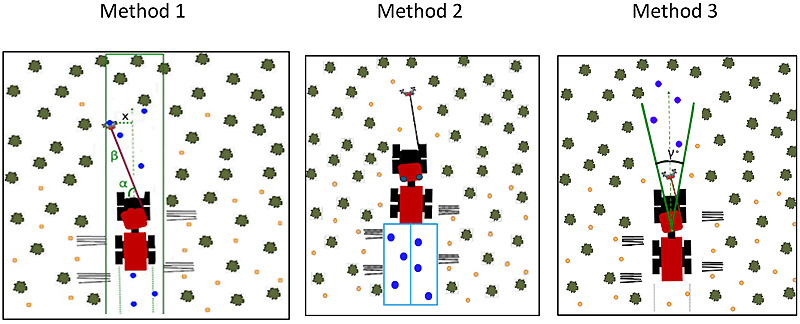
Fig. 1. Visualisation of the methods used to identify the strip-road trees.
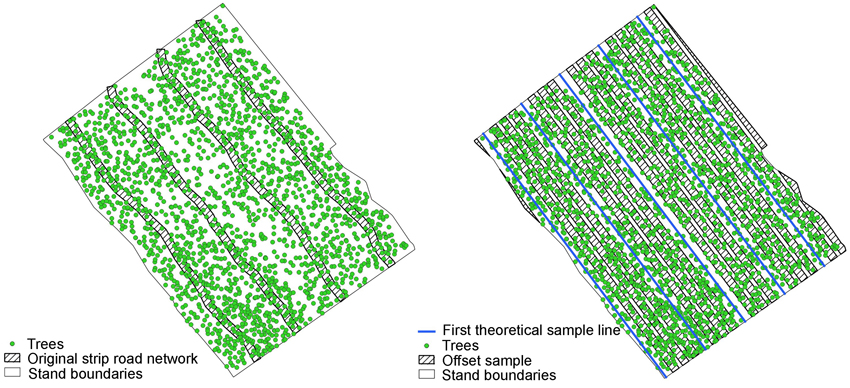
Fig. 2. Illustration of the original strip-road network (left figure) and three example offset sample networks from one stand (right figure). In total, 20 strip-road network positions were analysed stand-wise by shifting the network perpendicular to the strip-road direction in 1 m increments across the 20 m spacing.
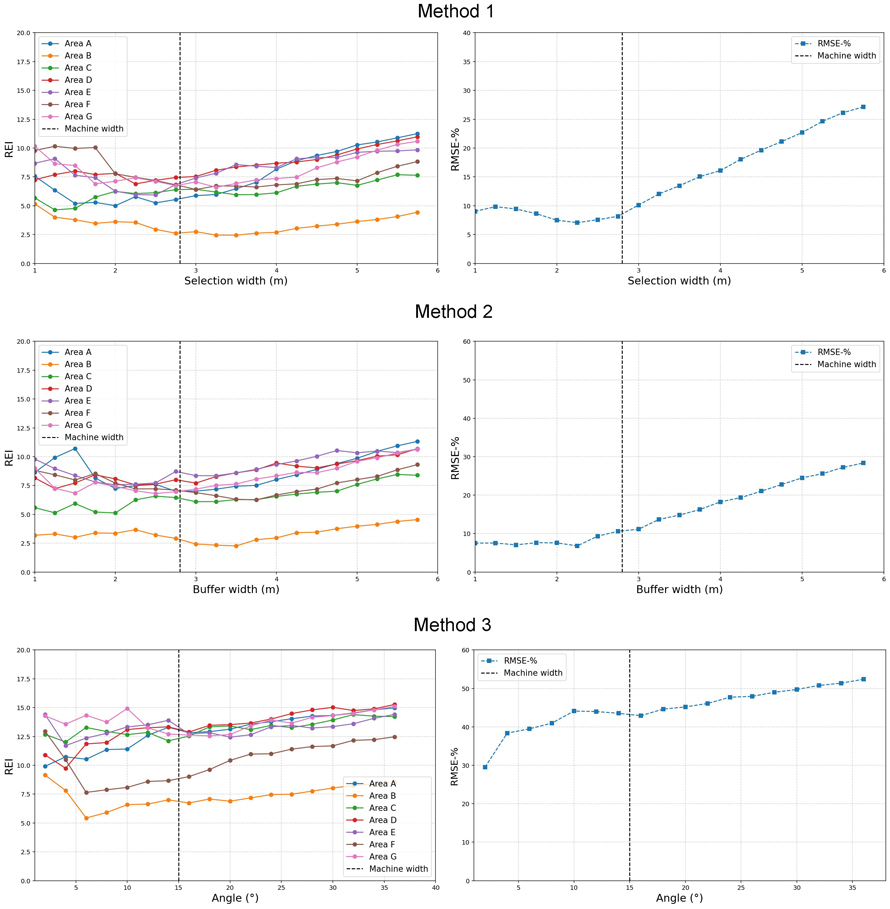
Fig. 3. Stand-wise REI values for each strip-road tree identification method and the relative RMSE values for all stands. View larger in new window/tab.
| Table 1. Hectare-wise stem counts of the reference data, original strip-road samples and offset strip roads showing the standard deviations (std) and minimum and maximum stem counts of the offset strip-road samples. | |||||
| Measurement area | Reference stem count (n ha–1) | Original strip-road sample stem count (n ha–1) | Offset mean stem count (n ha–1) | Offset stem count std (n ha–1) | Offset min–max count (n ha–1) |
| A | 1718 | 1525 | 1714 | 82 | 1537–1817 |
| B | 1250 | 1199 | 1253 | 73 | 1152–1400 |
| C | 1717 | 1534 | 1649 | 72 | 1548–1828 |
| D | 1654 | 1524 | 1649 | 73 | 1438–1776 |
| E | 1404 | 1288 | 1414 | 74 | 1289–1528 |
| F | 1435 | 1328 | 1443 | 105 | 1218–1604 |
| G | 1835 | 1699 | 1846 | 116 | 1661–2080 |
| Table 2. Hectare-wise basal areas of the reference data, original strip-road samples and offset strip roads showing the standard deviations (std) and minimum and maximum basal areas of the offset strip-road samples. | |||||
| Measurement area | Reference basal area (m2 ha–1) | Original strip-road basal area (m2 ha–1) | Offset mean basal area (m2 ha–1) | Offset basal area std (m2 ha–1) | Offset min–max (m2 ha–1) |
| A | 24.5 | 19.8 | 24.7 | 1.2 | 21.5–27.1 |
| B | 16.1 | 14.5 | 16.1 | 1.5 | 13.6–18.8 |
| C | 24.7 | 20.4 | 24.5 | 1.7 | 21.4–26.2 |
| D | 24.7 | 19.3 | 24.6 | 1.2 | 21.1–27.0 |
| E | 23.7 | 18.5 | 23.9 | 1.3 | 21.4–26.4 |
| F | 22.0 | 19.0 | 22.1 | 2.2 | 18.2–26.8 |
| G | 26.4 | 21.7 | 26.5 | 1.8 | 22.4–29.8 |
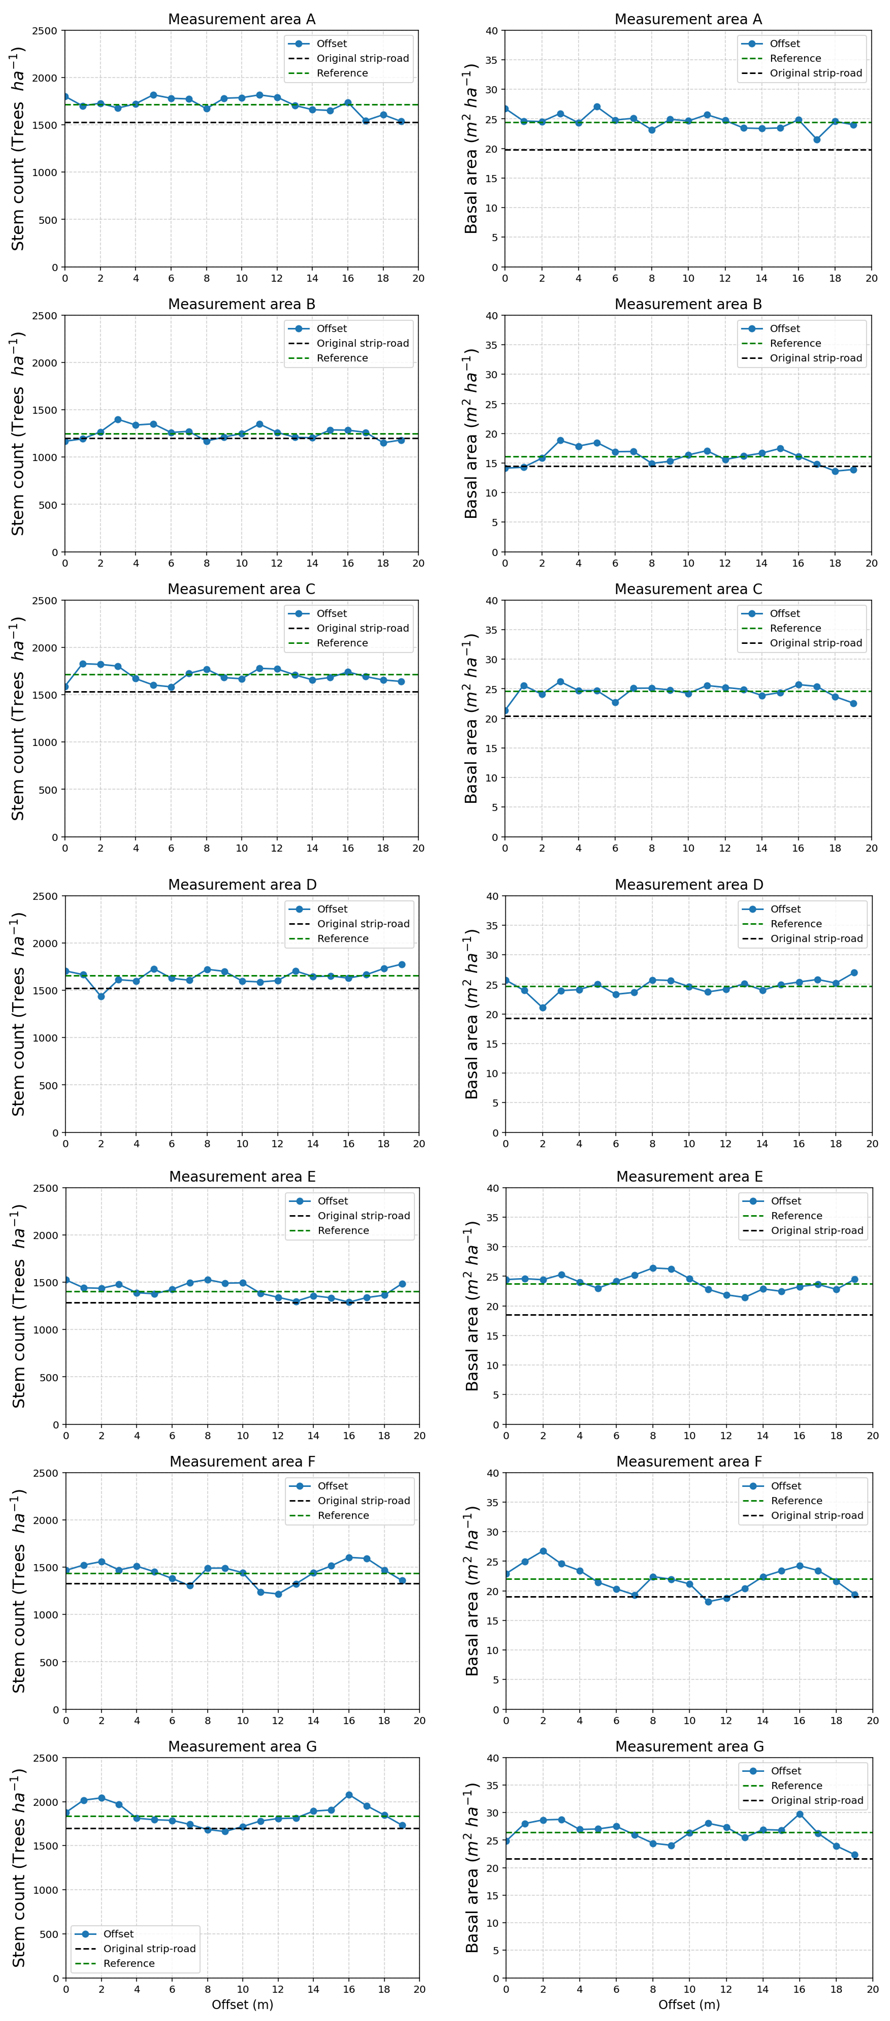
Fig. 4. Hectare-wise stem counts and basal areas for each offset sample (solid blue line with dots), reference value (green dashed line) and original strip-road sample (blue dashed line).