| Table 1. The basic stand data estimates for delimbed stems around Rovaniemi. | |||
| Parameter | Average | Standard deviation | Unit |
| Forwarding distance | 234 | 24 | m |
| Transportation distance | 79 | 27 | km |
| The volume of stems harvested | 35 | 14 | dm3 |
| Removal, number of stems per hectare | 1385 | 565 | stems ha–1 |
| Removal, m3 of stems harvested per hectare | 43 | 13 | m3 ha–1 |
| The percentage of Scots pine of total removal | 43 | 44 | % |
| The percentage of Norway spruce of total removal | 14 | 25 | % |
| The percentage of birch of total removal | 41 | 39 | % |
| The percentage of other broadleaf trees of total removal | 2 | 12 | % |
| Table 2. The wood properties of delimbed stems or chips produced from delimbed stems as a function of drying method and moisture content. | |||
| Material type | Moisture content, % | Average weight, kg m–3 | Standard deviation |
| Delimbed stems as fresh | 55 | 950 | 82 |
| Delimbed stems after storing | 40 | 662 | 57 |
| Artificially dried fuel chips | 40 | 710 | 61 |
| Artificially dried fuel chips | 30 | 609 | 52 |
| Artificially dried fuel chips | 20 | 533 | 18 |
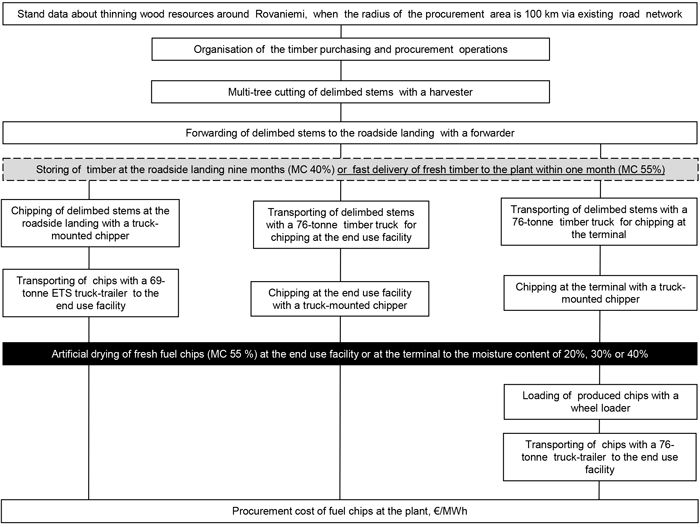
Fig. 1. The supply chains and forest resources of this study by the main work stages. View larger in new window/tab.
| Table 3. The productivity and cost parameters for the supply chains. MC = moisture content. | |
| The cost of organization, € m–3 | 3.2 |
| The stumpage price of delimbed stems, € m–3 | 5.5 |
| Hourly cost of the harvester equipped with multi-stem devices, € E15h–1 | 102.3 |
| Gross effective time (E15h) coefficient for multi-stem cutting | 1.39 |
| Hourly cost of the forwarder, € E15h–1 | 81.0 |
| Payload of the forwarder, m3 | 9.0 |
| Gross effective time (E15h) coefficient for forwarding | 1.3 |
| The cost of chipping at the terminal or end use facility, € m–3 | 5.5 |
| The cost of chipping at the roadside landing, € m–3 | 8.0 |
| Payload of the 76-tonne timber truck with fresh timber (MC 55%), m3 | 47.6–60.6 |
| Payload of the 76-tonne timber truck with stored timber (MC 40%), m3 | 63.8 |
| Payload of the 69-tonne chip truck with fresh timber (MC 55%), m3 | 38.5–48.9 |
| Payload of the 69-tonne chip truck with stored timber (MC 40%), m3 | 55.2–63.0 |
| Payload of the 76-tonne chip truck in the chip deliveries from the terminal (MC 20–40%), m3 | 61.1–63.0 |
| Table 4. Hourly cost details of the truck-mounted chipper capable of operating at roadside landings, terminals and end use facilities. | |
| Purchase price of truck-mounted chipper, € | 520 000 |
| Annual depreciation of purchase price, % | 17 |
| Lifespan, years | 7 |
| Productive machine hours per year, E15h–1 | 805 |
| Salvage value, € | 141 107 |
| FIXED COSTS: | |
| Depreciation, € a–1 | 54 128 |
| Interest, € a–1 | 17 881 |
| Insurance, € a–1 | 14 128 |
| Administration, € a–1 | 7500 |
| LABOUR COSTS: | |
| Annual working time, h | 2237 |
| Average wage for a worker, € h–1 | 18 |
| Indirect wage costs, % | 68 |
| Wage costs total, € a–1 | 67 640 |
| OPERATING COSTS: | |
| Fuel cost, € a–1 | 96 173 |
| Fuel price, € litres–1 | 0.9 |
| Blade cost, € a–1 | 10 146 |
| Lubricants | 2805 |
| Service and maintenance cost, € a–1 | 18 583 |
| Risk and profit margin (5%), € a–1 | 14 449 |
| TOTAL COSTS: | 303 433 |
| Operating hour cost for chipping, € E15h–1 (VAT 0%) | 376.8 |
| Table 5. Hourly cost details of the truck-trailers. | |||
| 69-tonne ETS chip truck-trailer | 76-tonne timber truck-trailer | 76-tonne chip truck-trailer | |
| Purchase price of truck, € | 166 300 | 193 800 | 166 300 |
| Annual depreciation of purchase price, % | 20 | 20 | 20 |
| Lifespan, years & kilometres | 10 & 756 830 | 10 & 756 830 | 7 & 657 842 |
| Salvage value, € | 17 856 | 20 809 | 34 876 |
| Purchase price of timber loader | - | 70 000 | - |
| Annual depreciation of purchase price, % | - | 20 | - |
| Lifespan, years | - | 10 | - |
| Salvage value, € | - | 7516 | - |
| Purchase price of trailer, € | 185 500 | 66 000 | 171 900 |
| Annual depreciation of purchase price, % | 25 | 25 | 25 |
| Lifespan, years & kilometres | 10 & 756 830 | 10 & 756 830 | 7 & 657 842 |
| Salvage value, € | 10 446 | 3717 | 22 946 |
| FIXED COSTS: | |||
| Depreciation, € a–1 | 32 350 | 29 776 | 40 054 |
| Interest, € a–1 | 7212 | 7133 | 8950 |
| Insurance, € a–1 | 8500 | 5500 | 8500 |
| Administration, € a–1 | 8443 | 8524 | 8429 |
| LABOUR COSTS: | |||
| Annual working time, h | 4320 | 4320 | 4320 |
| Average wage for a worker, € h–1 | 18 | 18 | 18 |
| Indirect wage costs, % | 68 | 68 | 68 |
| Wage costs total, € a–1 | 130 637 | 130 637 | 130 637 |
| OPERATING COSTS: | |||
| Fuel price, € litres–1 | 1.15 | 1.15 | 1.15 |
| Fuel consumption, litres100 km–1 | 62 | 63 | 66 |
| Fuel cost, € a–1 | 53 962 | 54 832 | 71 545 |
| Number of truck wheels and tyre price, € pcs–1 | 12*725 | 12*725 | 12*725 |
| Number of trailer wheels and tyre price, € pcs–1 | 10*450 | 20*450 | 18*450 |
| Service life of tyres, km | 120 000 | 120 000 | 120 000 |
| Number of remoulds during service life | 2 | 2 | 2 |
| Remould price, € pcs–1 | 300 | 300 | 300 |
| Tyre cost, € a–1 | 5947 | 8312 | 9733 |
| Service and maintenance cost, € a–1 | 32 000 | 32 582 | 32 000 |
| Risk and profit margin (5%), € a–1 | 13 953 | 13 865 | 15 492 |
| TOTAL COSTS: | 293 003 | 291 159 | 325 340 |
| Operating hour cost for terminal time, € E15h–1 (VAT 0%) | 46.5 | 45.2 | 49.1 |
| Operating hour cost for driving time, € E15h–1 (VAT 0%) | 67.8 | 67.4 | 75.3 |
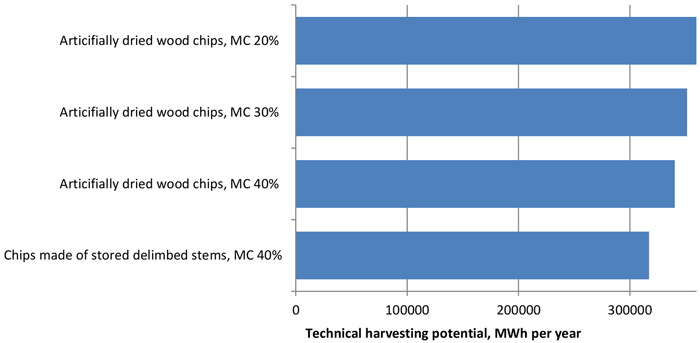
Fig. 2. The technical harvesting potential of delimbed stems around Rovaniemi, when the moisture content of produced chips is 20 %, 30% or 40%.
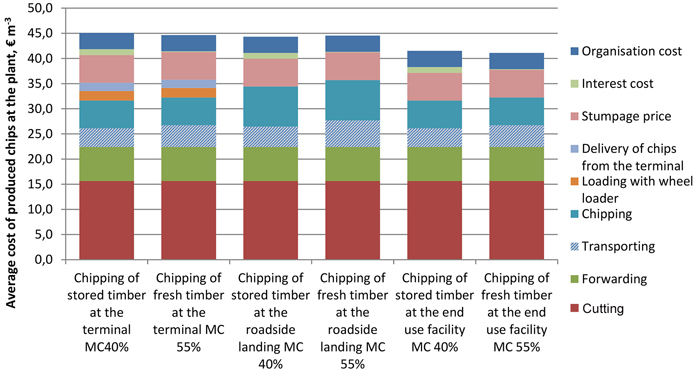
Fig. 3. The procurement cost structure of the supply chains and raw material options of this study. Costs are based on average values in the procurement area of Rovaniemi (cf. Table 1, 2 and 3).
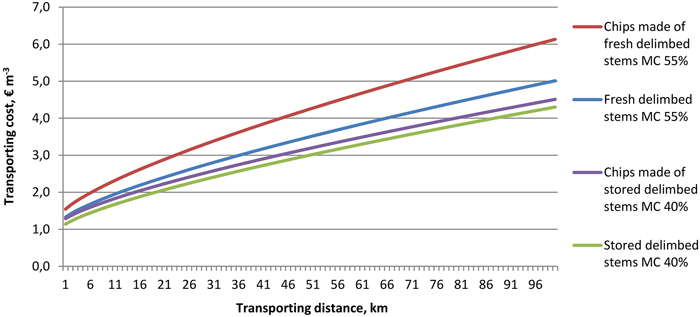
Fig. 4. Transporting costs of delimbed stems and chips as a function of transporting distance, when the moisture content (MC) is either 40% or 55%.
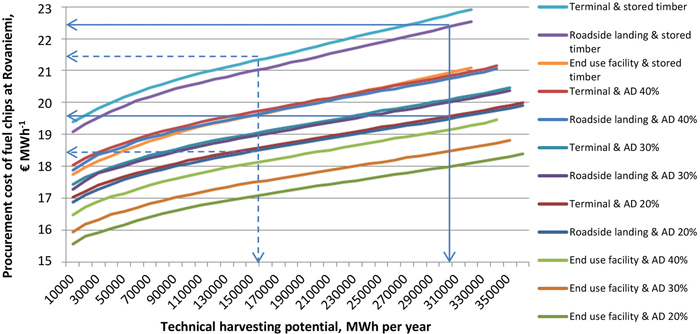
Fig. 5. The procurement cost of fuel chips around Rovaniemi when using alternative supply chains and alternative moisture contents and storing options for produced chips. AD = artificial drying.